Summary
Measuring the attitude of structures in drill core requires fully oriented core. But the tools for orienting core currently available to drillers often fail, especially with small core diameters (NQ or less) and where the rock has fissile surfaces within it. As these failures are not always apparent at point of core recovery, geologists can make incorrect measurements which are then entered to data bases and become input for computer programs.
This post details how these failures occur and presents stereographic techniques which can help identify and quantify them.
How geologists measure Structure in Oriented Drill Core
Many geologists confuse the terms “oriented drill hole” and “oriented drill core”.
An oriented hole is one where the attitude of the drill hole throughout its depth range has been determined by a down-hole orientation survey.
The attitude of the long axis of core from an oriented hole is the same as the attitude of the hole itself. But core is still not fully oriented because, through drilling and extraction, it has been rotated by an unknown amount about that axis.
Fully Oriented core is core in which the original down gravity vector across it has been determined by a core orientation survey carried out by the driller.
The difference between oriented and non-oriented core is illustrated in the cartoons below.

Figure 1: Although the orientation of the core axis may be known, the core has rotated by an unknown amount around that axis.
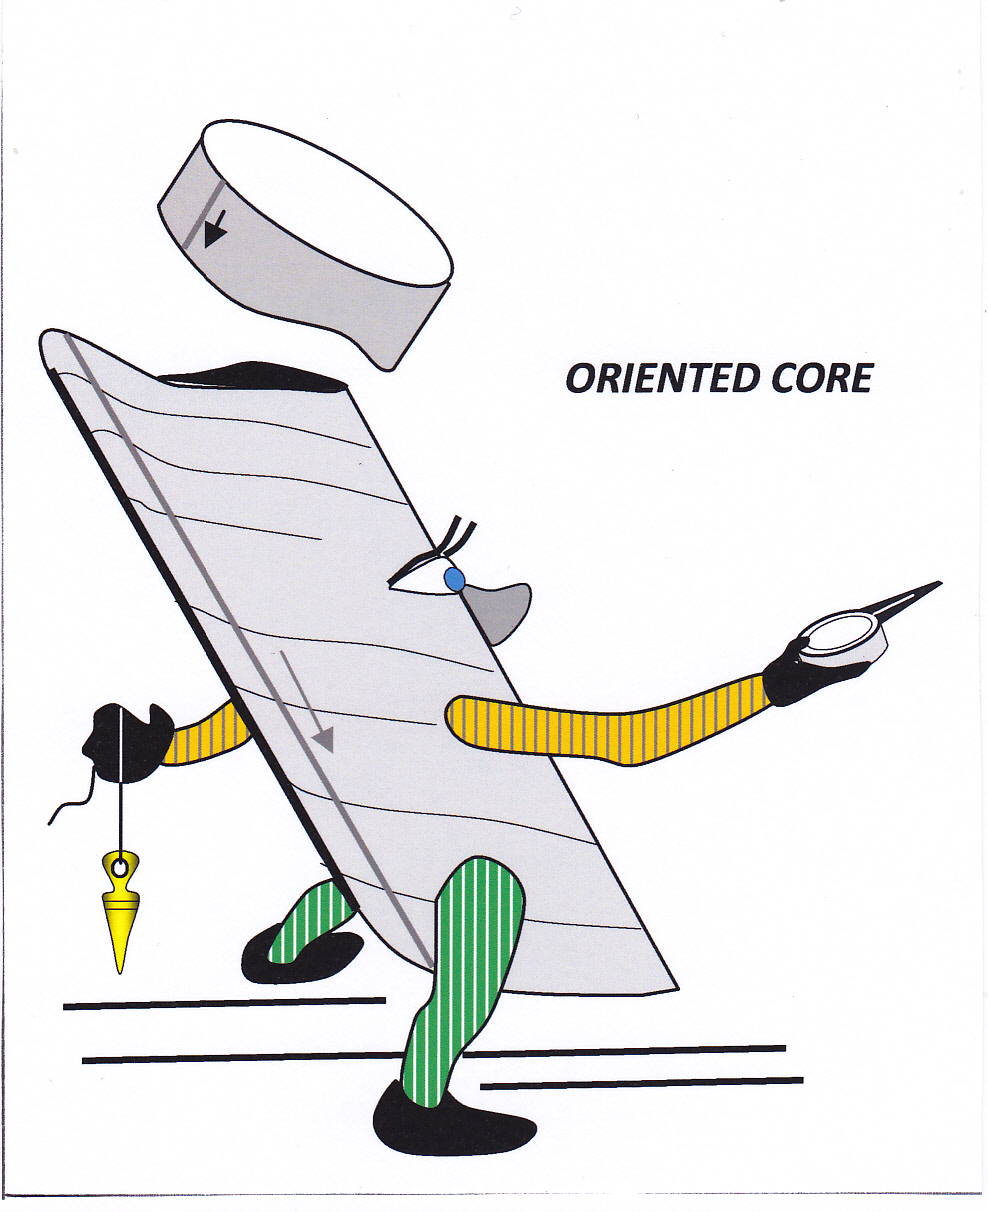
Figure 2: The core is now fully oriented in 3D space.
The most common type of geological structure measured in oriented drill core are planar (e.g. bedding, cleavage, veins, joints etc.). Assuming that the core has been correctly oriented, the best way to do this – one that produces fewest errors and creates the greatest geological understanding, is by using a geologists’ compass to directly measure structure in core pieces that have been set up in their original orientation using a Core Orientation Frame (for further discussion on this subject see my blog post HERE).
However, no doubt because it is quick, easy and involves minimal mental involvement, most geologists today measure the attitude of planes in oriented core by the Internal Core Angles Method. The method was developed by geotechnical engineer R.E. Goodman in 1976 (1). It involves measuring the angles which the structure makes with lines of known orientation in the core. These lines are the Core Axis (CA) - whose attitude is known from a hole orientation survey – and the Bottom of Hole (BOH) line, which today is based on the mark made on the end piece of each core run by the driller using a proprietary core orientation tool.
These angles are:
Alpha (α) – the acute angle (0°-90°) between the core axis (CA) and the long axis of the intersection ellipse (E-EI). The intersection ellipse is the trace of a plane on the cylindrical core surface. See figure 3.
Beta (β) – the radial angle (0°– 360°) measured in a clockwise direction about the core circumference from the Bottom of Hole Line (BOH) to the down-hole end of the intersection ellipse. Note that “clockwise” is determined by looking down the core axis (figure 3).
In all holes drilled at an angle below the horizontal (negative inclination: virtually all holes drilled from the surface) the down direction points away from the hole collar. In holes drilled above the horizontal (positive inclination: many underground holes) the down direction will point towards the collar.
To get any useful meaning from alpha and beta measurements, they have to be recorded in data base where they can be processed by a computer along with surveyed hole orientation data. The computer then outputs standard strike and dip measurements which can be displayed in tables, stereonet plots, histograms or intersection lines on drill sections.
But if you are measuring alpha/beta, you don’t need a computer program. All these processes can be carried manually with the simple low-tech stereonet. For details on how to do this, see my blog post HERE.
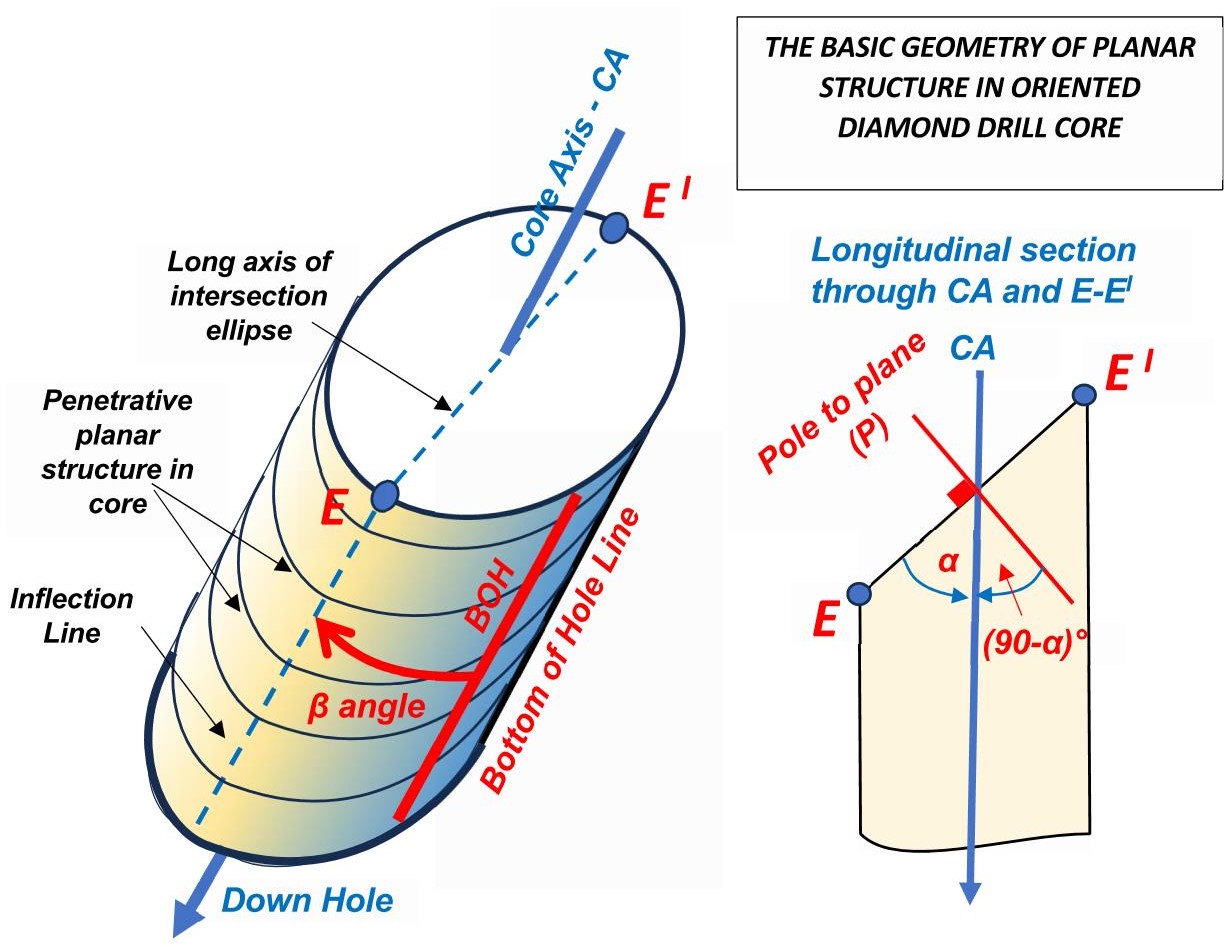
Figure 3: The internal angles alpha and beta which define the orientation of a planar structure in oriented drill core.
Potential Errors in Measuring Alpha and Beta
Measuring the alpha angle is quick and easy using any standard protractor. The core does not need to be oriented. You do not need to know which end of the piece of core points up the hole and which points down. All values of alpha from 0 to 90 degrees can be measured with the same level of accuracy. Where the planar structure is well defined and reasonable care is taken by the geologist, measured alpha angles can usually be taken as accurate to at least +/- 2°.
Alpha numbers are seldom a source of error in computer input.
Errors in measuring beta cause most errors when using the internal core angles method.
To enable accurate measurement of the beta angle on a plane we need two things: an accurate Bottom of Hole (BOH) line along the core and a well-defined defined point E on the trace of the plane on the core surface.
For an accurate BOH line, the orientation mark made by the driller on the end of a run of core must be accurate and someone must have correctly re-assembled the run by matching broken core pieces and then transferred the driller’s mark along the run as a BOH line.
Point E is the point of maximum inflection on the elliptical trace of the plane on the core surface and its position must be judged by eye. Where the plane lies at a low angle to the core axis (low to medium alpha angles) E is sharply defined and can generally be located with acceptable accuracy. Higher alpha angles lead to an increasingly poor ability to exactly locate E because, at high alpha angles, the inflection point is less well defined. At alpha greater than 65°, the intersection ellipse more closely resembles a circle than an ellipse, but this seldom matters because high alpha angles mean that your drill hole is approaching normality to the plane you are measuring and an approximate strike and dip can be calculated with ease using Year 5 mental arithmetic: there is no need to resort to meaningless measurements, Greek symbols and computer programs. I explain all this in a previous post HERE.
To summarise the above: the most important factor controlling the accuracy of beta angles is the accuracy of the driller’s orientation mark.
Problems with Core Orientation Tools
There are a variety of tools currently available to drillers for orienting core. The tools, although mostly reliable, are capable, under various circumstances, of producing grossly inaccurate results. It is not always easy for the driller or the geologist to know when this has occurred.
Unfortunately, problems with inaccurate drillers orientation marks have become worse over the past 10-15 years due the progressive replacement of mechanical core-stub (front end) orientation tools with electronic core barrel (back end) orientation tools.
This is a big and troubling subject on which I have written a separate post. You can read it HERE.
Mismeasurement of beta due to inaccurate core orientation is the major source of error when using the internal core angles method.
Stereonet Validation
Once a set of measurements have been made on oriented core, there is a simple test to determine if inaccurate beta numbers are affecting your results (see Figure 6). Plot your dip and dip direction results from measured planes as poles on a stereonet. Mining software programs such as Micromine have subroutines to do this, but it is not hard to do it manually. For a set of measurements through a volume of rock, the distribution of poles (see definition below below) can enable deductions to be made about the accuracy of your measurements or whether or not they are made from approximately parallel surfaces.
As a bonus, stereonet plotting of structural measurements can enable interpretation of your results in terms of geological processes, as well as highlighting methodological weaknesses in procedure.
But first…
A Quick Primer on the Stereonet
A Stereonet is a pre-printed net of intersecting lines which allows the three-dimensional attitude of measured linear or planar rock structure to be shown as points on a two-dimensional graph. Linear structures (1D) such as fold axes, lineations or drill holes all plot as points on the net. Planar structures (2D) plot as great circles on the net, but their attitude can also be shown as a single point by plotting the line at right angles to that plane. This is called the Pole to the plane. A number of measurements of a planar structure that are plotted on the net as Poles is known as a Pole Figure.
The scales of the net then offer a quick and easy way to provide approximate solutions to problems in 3D geometry, in much the same way as the scales on a slide ruler allow numerical solutions to math problems. Cheap pocket calculators, first appearing in the 1970’s, have now replaced slide rulers. Computer software can solve problems in 3D geometry too, but as a cheap, quick, low-tech and always available tool, the stereonet still has a useful role to play in this area. In structural studies, approximate solutions (i.e., to the nearest few degrees) are usually all that can be expected and all that is required.
But an equally important role of a stereonet plot is to provide a graphical way of showing spatial distribution patterns of a series of orientation measurements taken through a volume of rock. Our brains are analog computers, fine-tuned for recognizing visual patterns (sometimes too fine-tuned). Patterns of plotted points on a net can thus be a great aid in the interpretation of underlying geological processes. But these patterns need to be distinguished from merely coincidental aggregations of random numbers or from the effects of systemic problems with data collection and input. Thus, stereonet plots of structural measurements can be a powerful tool in the validation or interpretation of data.
Below are examples of these effects.
Four Examples of Stereonet Pole Figures for Measurements in Oriented Core or Outcrop
1. If the results of your measurements of a planar structure across an area or a through a volume of rock are random, a pole figure will look something like that of figure 4 - a plot constructed using a random number generator. On your plot you may see partial patterns of lines or circles or ellipses or clumping of points, but these are coincidental and have no meaning.
If you get a random distribution like this from a real set of measurements, it probably means that your measurements were collected across different structural domains.
Solution: Identify the different structural domains in the area by other means. Surface mapping is a good place to start. Group your measurements by domain and plot each group separately.
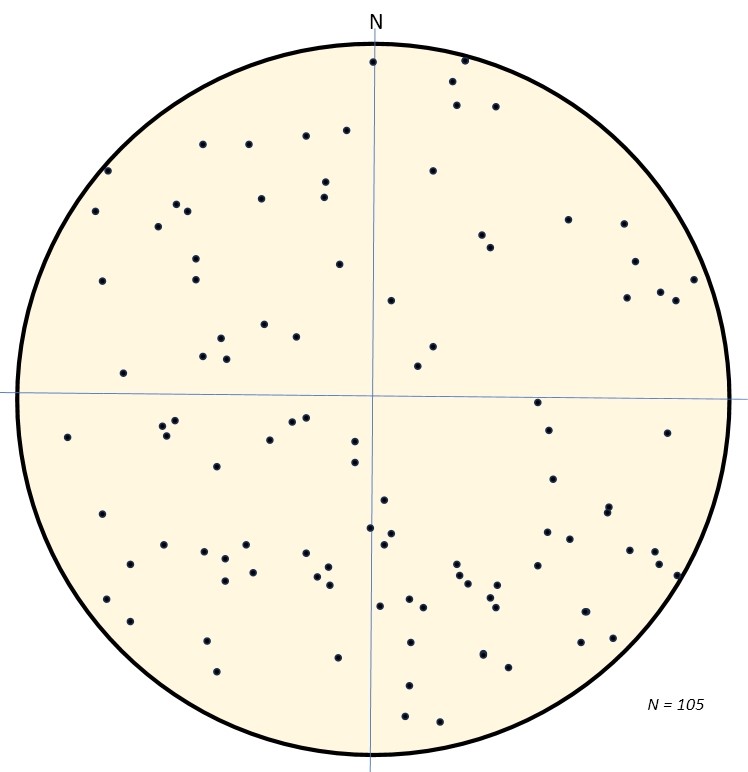
Figure 4: A stereonet plot of poles to bedding created using a random number generator. Any patterns or concentrations of points that a visual inspection might suggest are purely coincidental and have no real world meaning. If this was a real set of measurements across an area, then the most probable interpretation would be that the measurements were taken across several distinct structural domains.
2. If your measurements are accurately made on a set of parallel, or approximately parallel, planar structures with constant attitude, then the majority of points on a pole figure will form a tight cluster, as shown in figure 5.
If your measurements were made on oriented core, then the centre of the cluster will lie at an angle of 90-α° to the core axis.
Q: What is the logic behind the angle 90-α°?
A: This is a plot of poles to planes measured in oriented core. If you refer back to figure 3, you will see the poles to these planes lie at 90-α° to the core axis (CA).
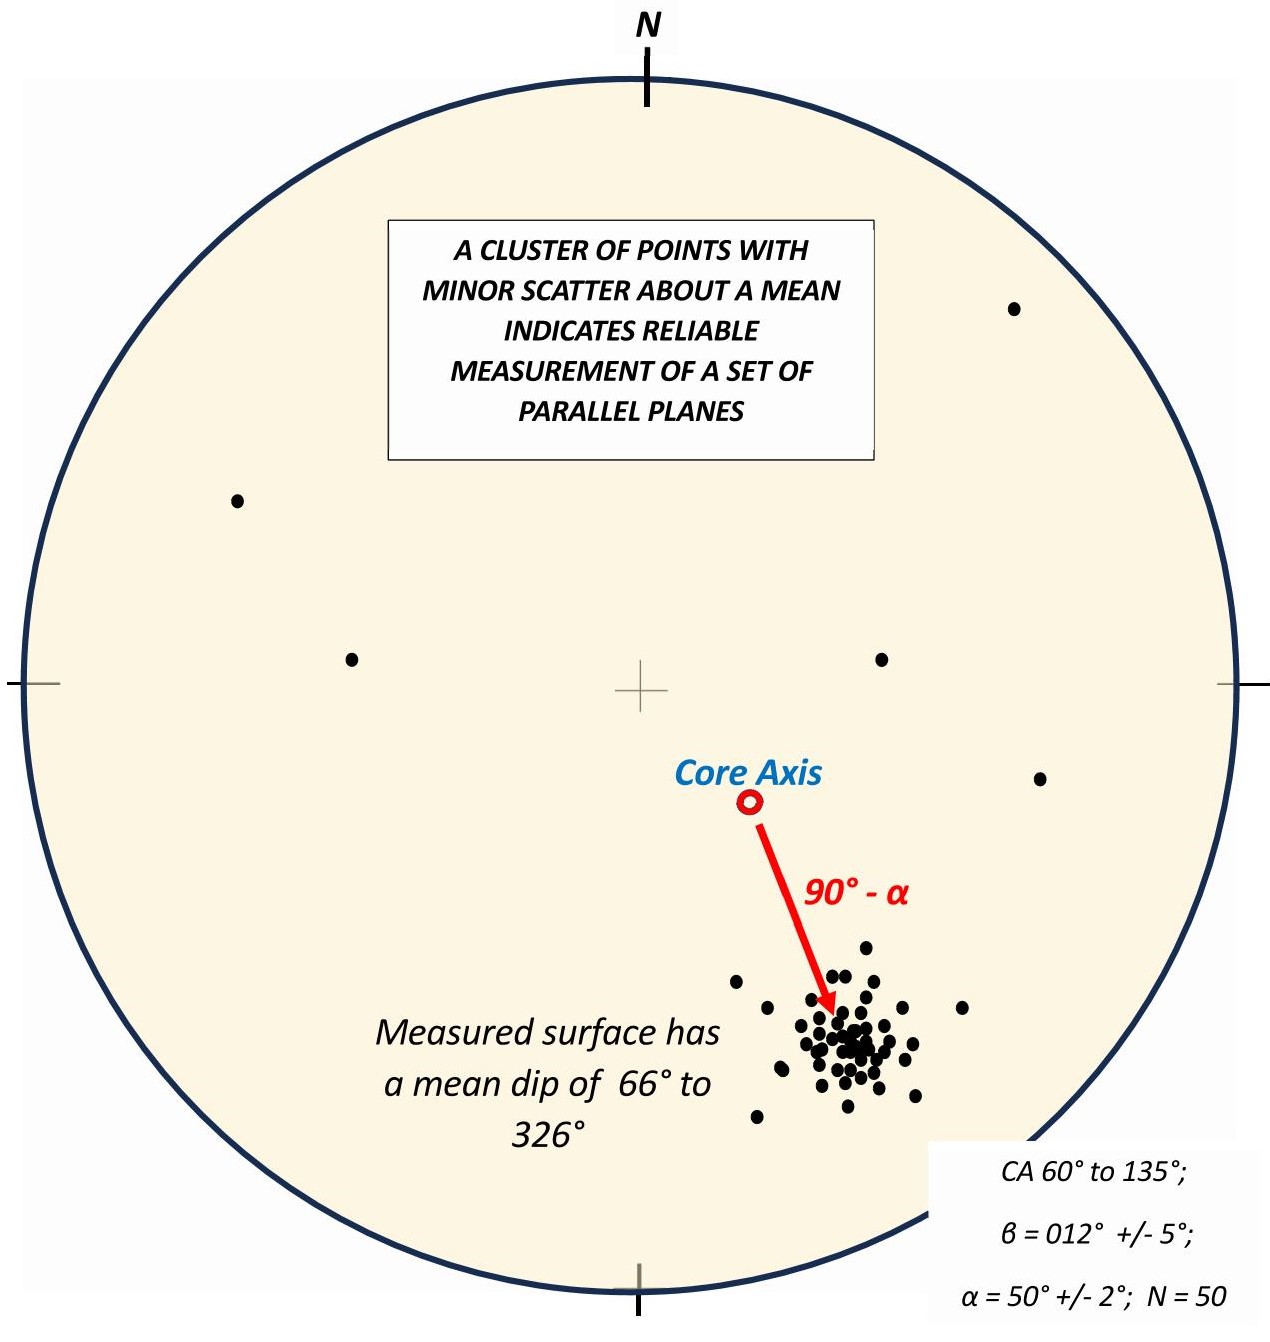
Figure 5: Poles to planes measured in oriented drill core by the internal core angles method. The orientation of the core axis is shown as a red circle. The results indicate the planes are approximately parallel with only minor, acceptable, error in both alpha and beta measurements. The centre of the pole cluster lies at 90-α° to the core axis. Click for a sharper image.
3. If you are plotting alpha-beta measurements from oriented core, the measurements can be assumed accurate as regards to the alpha number. On a steronet alpha will plot somewhere along a small circle at 90-α° to the core axis. Small alpha angles produce large “small circles”. Large alpha angles produce small “small circles”. The pattern shown in figure 6 is based on an alpha angle of 60 degrees.
The beta angle determines the position of any given measurement on the small circle. If your betas are accurate, and measurements have been made on a set of parallel planes, their poles will clump in a restricted zone on this circle. If your betas are inaccurate, the pole plot will tend to outline the small circle as shown on figure 6. If the measured planes are not parallel, they will be all over the net, as shown on figure 4.
Note that the problem with inaccurate beta angles is greatest where the alpha angle is low and small circle girdles consequently large. It diminishes with increasing alpha angles where small circle girdle plots progressively become smaller and converge on singularity.
There is no geological process which will produce a small circle pattern on the net.
Possible Solutions:
Check that marking up the core has been done correctly. Check that your measurements of beta have been done as accurately as possible. Check to see if inconsistent or abnormal beta measurements can be isolated to particular core runs and discard all data from these runs. If none of that helps, switch to using a core-stub orientation system on all future holes.
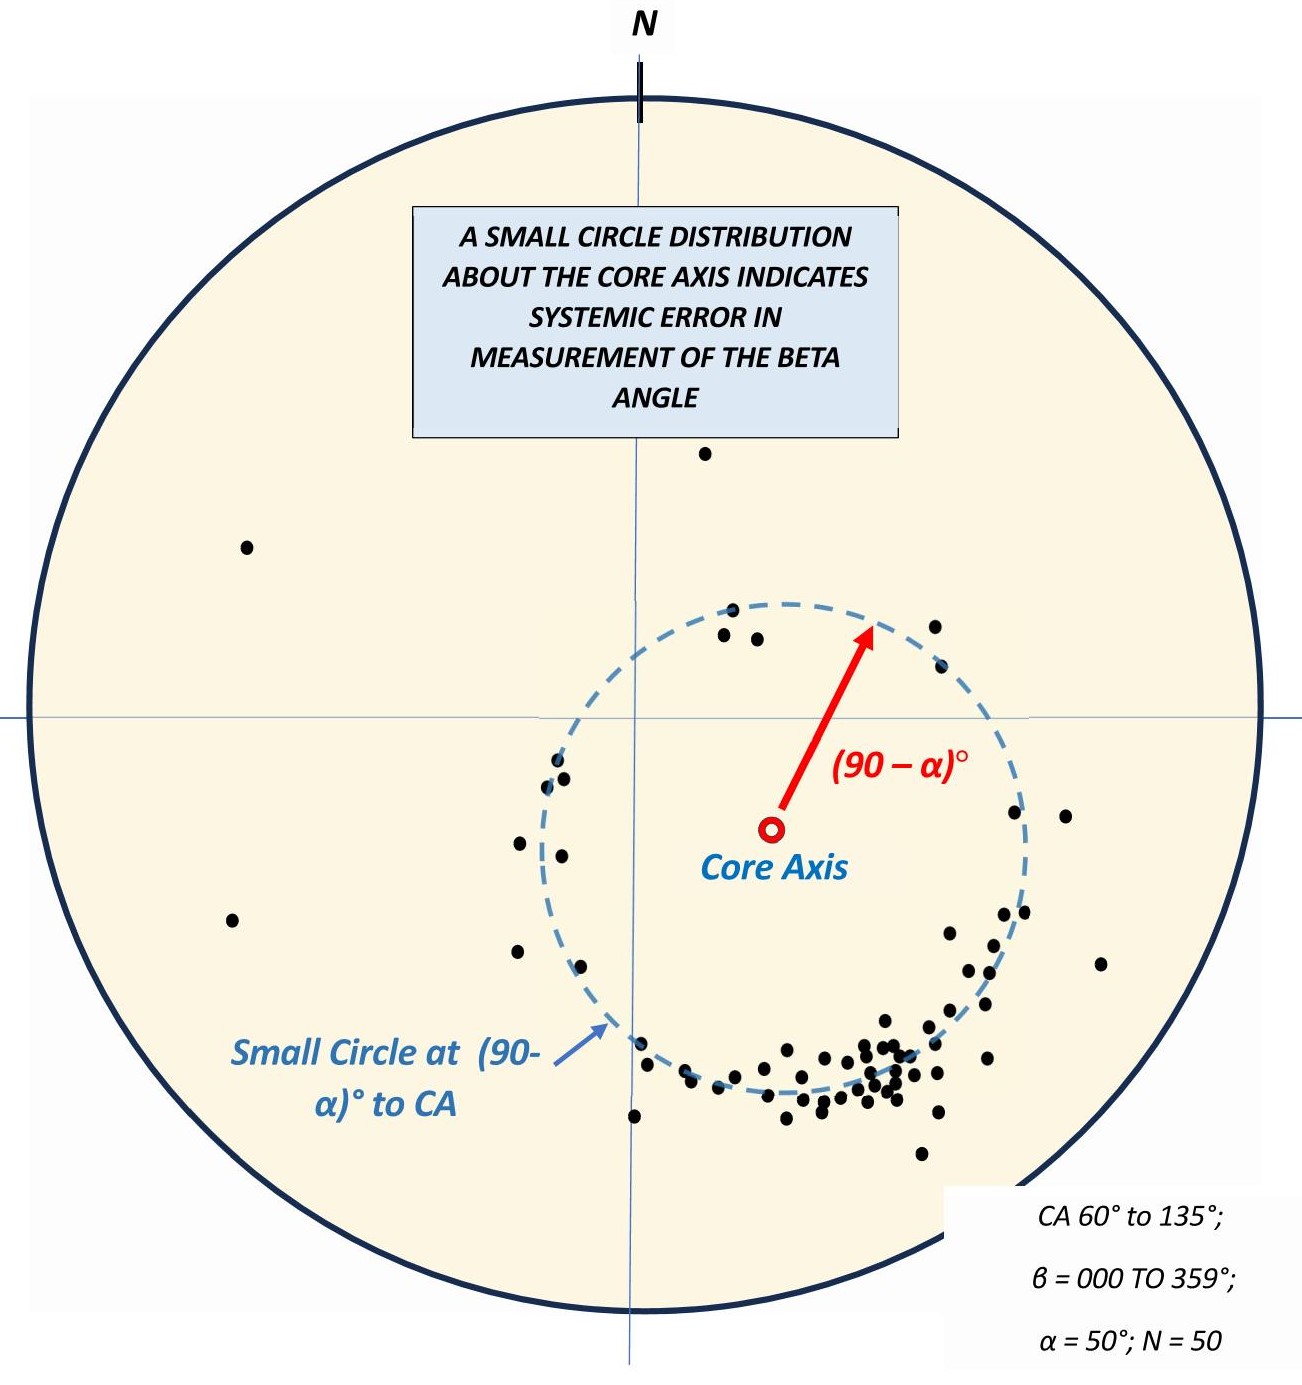
Figure 6: Poles to a set of planes measured in oriented drill core by the internal core angles method. The consistency of alpha indicates accurate measurement on planes that are approximately parallel. However, the scatter of points around a small circle at 90-alpha degrees to the core axis indicates that large random errors have been made in the measurement of beta. Click for a sharper image.
4. If the Pole Figure for of large number of orientation measurements taken from scattered surface outcrop or oriented drill core shows distribution about a great circle on the net (figure 7), we can draw several conclusions.
- The results indicate accurate measurement from a volume of rock containing a set of approximately parallel surfaces.
- Although the measurements show a wide range of orientation, these are distributed in a systematic way that indicates they were taken from a geologically coherent structural domain.
- The measured planes have been affected by a cylindrical fold, or a set of parallel cylindrical folds of similar style
- A line at 90° to the great circle distribution will plot as a point in the opposite segment of the net. This point represents the attitude of the fold axis or axes that are affecting the surfaces. In structural geology, this point is conventionally labelled with the Greek letter π (pronounced pi).
Note that two concentrations of poles appear on the great circle of figure 7. If your plot shows this pattern, it indicates a predominance of measurements taken from relatively extensive, planar limbs of the fold or folds, compared to fewer measurements taken on restricted hinge areas. This happens where the folds sampled by your measurements are similar, rather than concentric, in style.
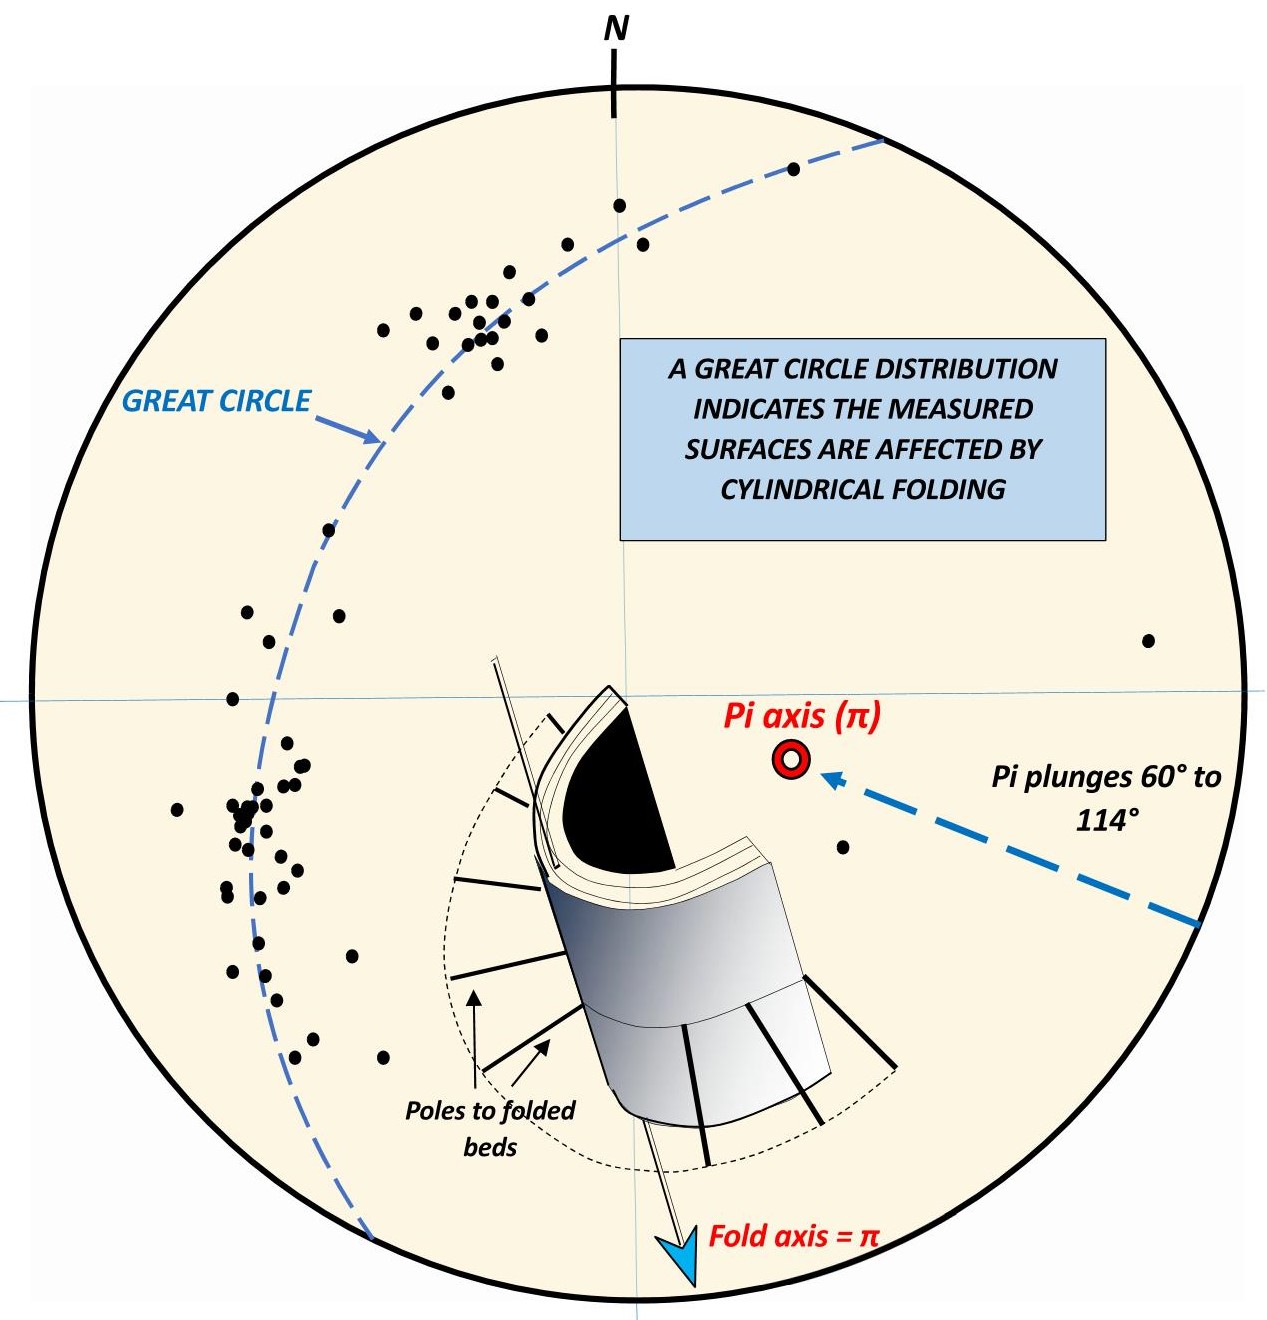
Figure 7: Poles (n=50) to a set of bedding planes measured across scattered surface outcrop or oriented drill core. The great circle distribution indicates folding about a cylindrical fold, or a set of parallel such folds. Click for a sharper image.
Footnote
(1) Goodman R.E.: 1976. Methods in geological Engineering in Discontinuous Rocks. St Paul, Minnesota West, 472 pages.