This post, the third part of a series (for parts 1 and 2 see here and here), is about the appearance of common geological structures on the surface of diamond drill core.
Visualising complex objects in three dimensions isn’t easy, although geologists are better at this than most. Two dimensional objects are an order of magnitude easier to comprehend. But there are potential traps in interpreting 3D shapes and relationships from 2D slices across it. I will illustrate some of these problems with specific examples involving faults and folds and lineations in rock surfaces that a mining geologist will see in surface outcrop, open cuts and diamond drill core.
This post is in three parts. Part one deals with faults and sense of movement indicators. Part 2 describes problems interpreting folds using an example of correlating geological interpretation of surface maps and drill sections. This final part concerns lineations, planar beds and small folds, but specifically the interpretation of these structures when exposed on the cylindrical surface of diamond drill core.
I have no doubt that many experienced geologists will find my examples and explanations self-evident, even trivial. But bear with me, not all geologists are experienced, not all spend much time interpreting maps and drill core, and even non-geologists might find my examples instructive.
In diamond drill core structures are typically exposed where they intersect with the cylindrical surface of the core. This is a 2-dimentional surface but one that is curved through 360° so providing 3-dimentional information. The core surface thus has a fractal dimension somewhere between 2D and 3D – possibly a dimension of 2.1D[1]. The continuously-curved surface can produce complex outcrop shapes and patterns which, at first glance, can often be hard to interpret.
Lineations
Geometrically, the simplest possible structure is a lineation, which, to a first level of approximation, is essentially one-dimensional. Examples of lineations that might be seen in drill core are illustrated below:
Click on image for full-sized version
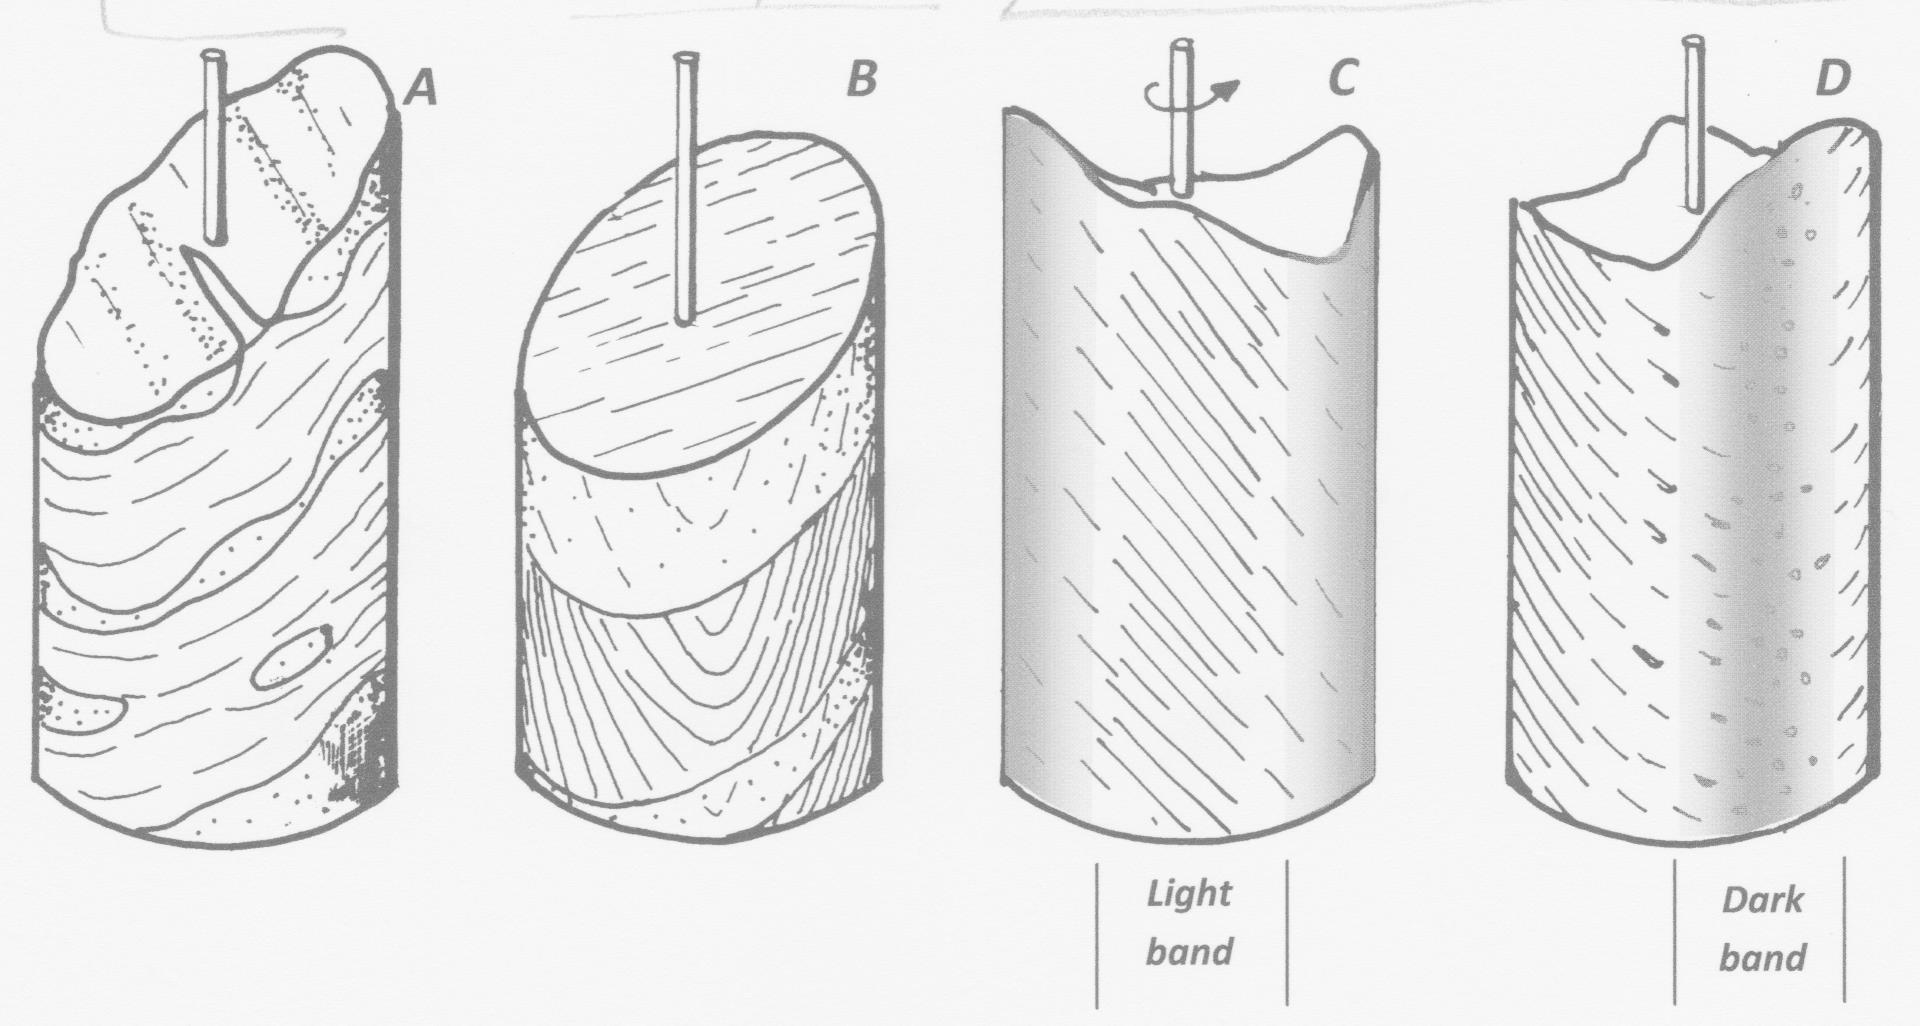
In the figure, A represents flattened, stretched clasts or beds known as boudins. B shows lineations caused by the intersection of bedding and an oblique cleavage. C and D are two views, spaced 90° apart, of the face of a piece of core containing a penetrative (i.e. present throughout the rock) lineation that is defined by an aggregate of parallel, elongate minerals – most probably an amphibole. These three types of linear structure will be referred to here as linears.
In each case, the linear is exposed on the core surface as two points, or rather two small spots since geological linears are never mathematical lines with no cross-sectional area. One spot is where the linear enters the core and the other where it exits the core. Each spot is a section across the linear element and its size and shape depends upon the angle which the linear makes with the core surface. For any given linear, the smallest section area (the smallest spot) will be represented by those linears which make the highest angle with the core surface. These are the linears which pass through, or close to, the Core Axis. The greatest section area will be those linears which have the smallest angle of intersection with the core surface. These are the linears which are furthest from the core axis and graze the core tangentially. Since a core surface curves through 360° it is obvious that, where a collection or bundle of parallel linear elements (as in C & D, above) intersect core, all possible intersection shapes will be produced with continuous variation between these shapes around the circumference of the core. Taken together, the intersections of those linears intersecting the core at a high angle (i.e. those which pass through or near to the Core Axis) will form two bands running along the length, and on opposite sides, of the core. Along these bands the surface of the core will often be relatively rough because in this zone the drill bit, in cutting the core, has broken, in a brittle fashion, across the linear elements. The roughness of these zones leads to poor light reflection and hence dark coloured bands along the core. By contrast, those linears that intersect the core at a low angle will form two bands with a relatively smooth surface (and high light reflectivity) because here the drill bit has cut parallel to the linears and parallel to crystal faces. These zones form two light coloured, high reflective, bands that run along the length of core exactly mid-way between the dark coloured bands.
What is the practical use of this observation? Well, fine penetrative lineation in a rock can often be hard to spot, but if you observe alternate bands of dark and light running along the length of the core surface you can be always be sure that that you are dealing with a cryptic penetrative mineral lineation.
Planes
Geometrically, the next most complex structure encountered in core (and by far and away the most common) is a 2-dimentional surface such as a sedimentary bedding plane, a cleavage, a vein or a fault. Examples of bedding and cleavage in drill core are illustrated below:
Click on image for full-sized version
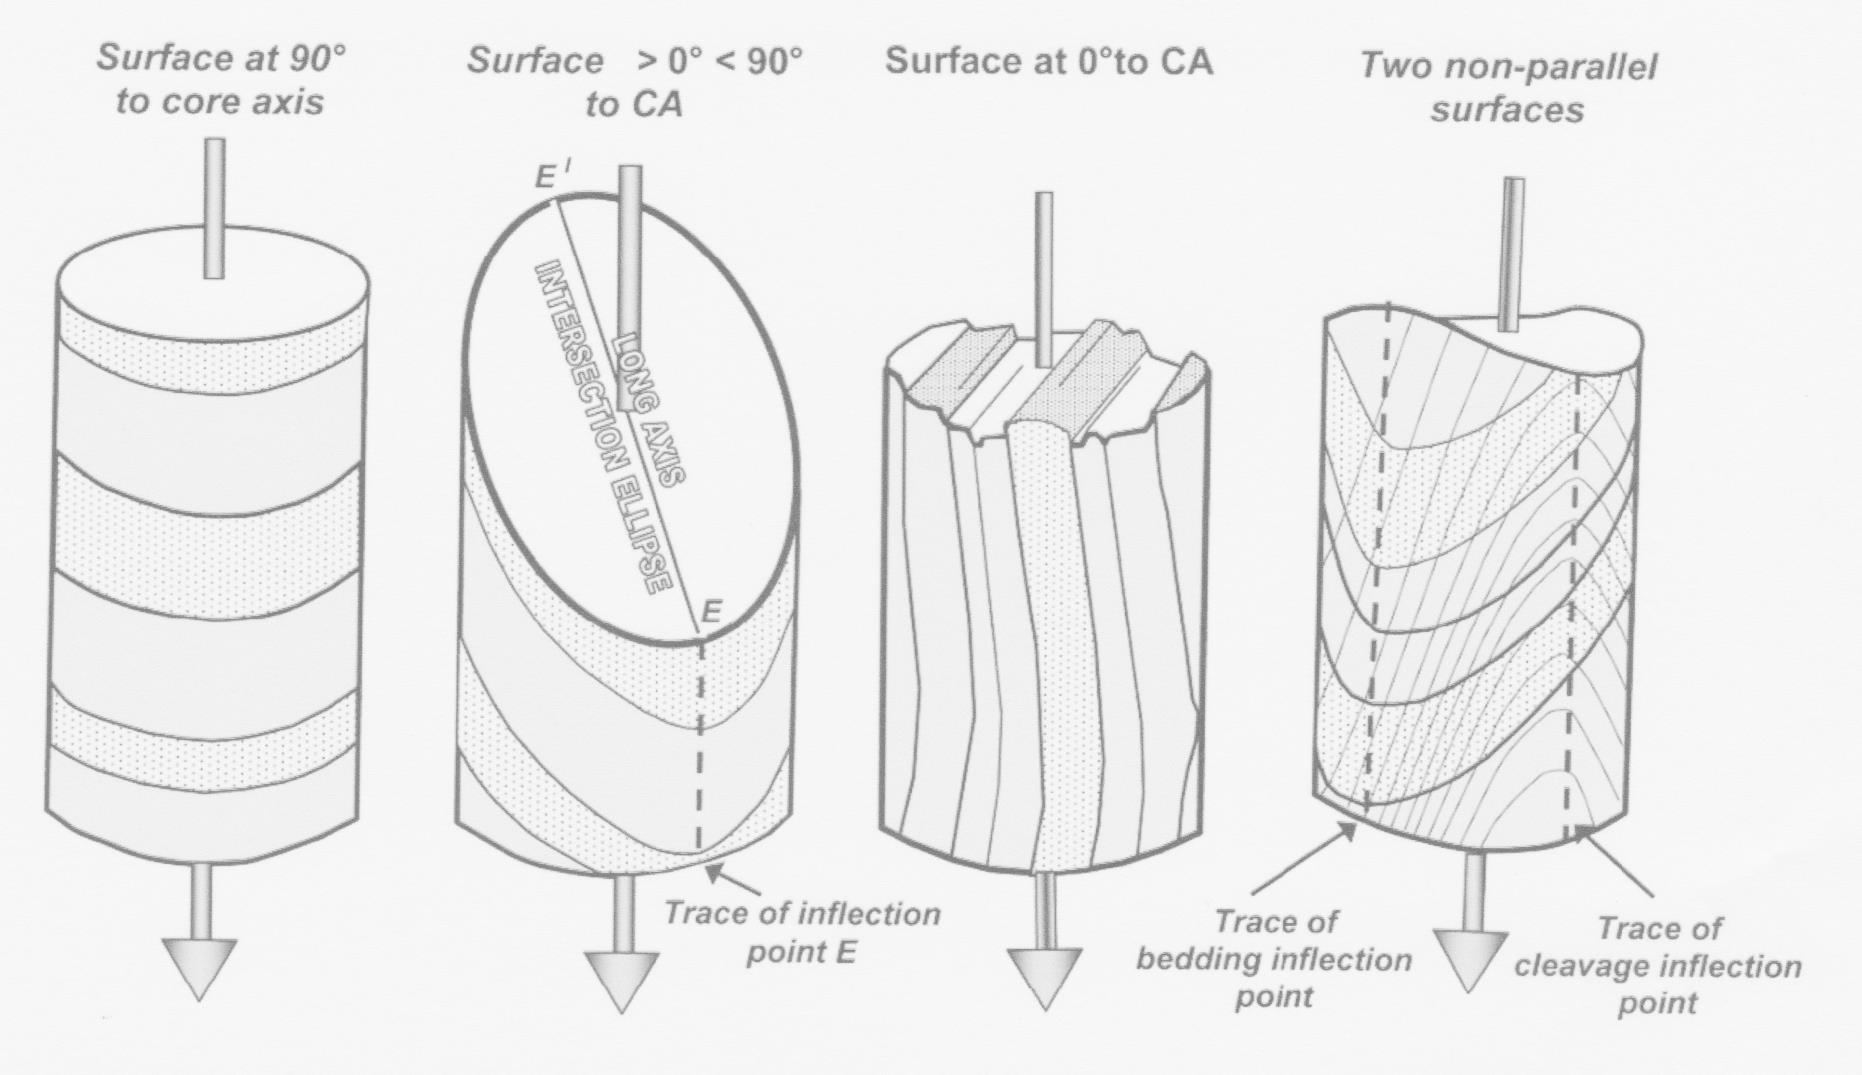
The intersection of any plane that cuts across a cylinder is a continuously-curved, closed shape known as an intersection ellipse. Ellipses are defined by two axes at right angles to each other – a long axis and a short axis. The short axis lies in the cross-section plane (i.e. the circumference plane, at right angles to the core axis) of the core and has an invariant length that is always equal to the core diameter. The long axis of the ellipse intersects the core surface at two diametrically-opposite points that are defined on the core surface by the points of maximum curvature of the ellipse – these are called inflection points. The inflection point which makes an acute angle with the down direction of the core axis (CA) is called Point E: the other inflection point is called point E’ (E primed) (see figure above). The acute angle between E-E’ and CA is known as the alpha angle for that plane . If a stacked series of parallel surfaces are present (a common situation: for example, bedding planes, penetrative cleavage) then the inflection points of all planes of that orientation line up along the length of the core. A line through the inflection points is called the inflection line for that set of surfaces.
Where the plane is at right angles to the core axis (alpha = 90 degrees) the long axis of the ellipse is the same length as the short axis and the ellipse simplifies to a circle. In this case there are no defined ellipse axes and no inflection points. As the angle (alpha) between plane and core axis decreases, the intersection ellipse becomes more elongate and the inflection points E & E’ sharper and more defined. When the angle between the ellipse long axis and the core axis is zero (alpha = 0 degrees), the long axis has infinite length, there is no elliptical intersection and the plane simply trends down the core, in theory forever, but in practise only for as long as this particular geometry holds good (seldom more than a few metres in actual core).
All this may sound very complicated, but the relationships are relatively easy to comprehend and cause problems for few geologists. The illustrations above should make things clear.
Folds
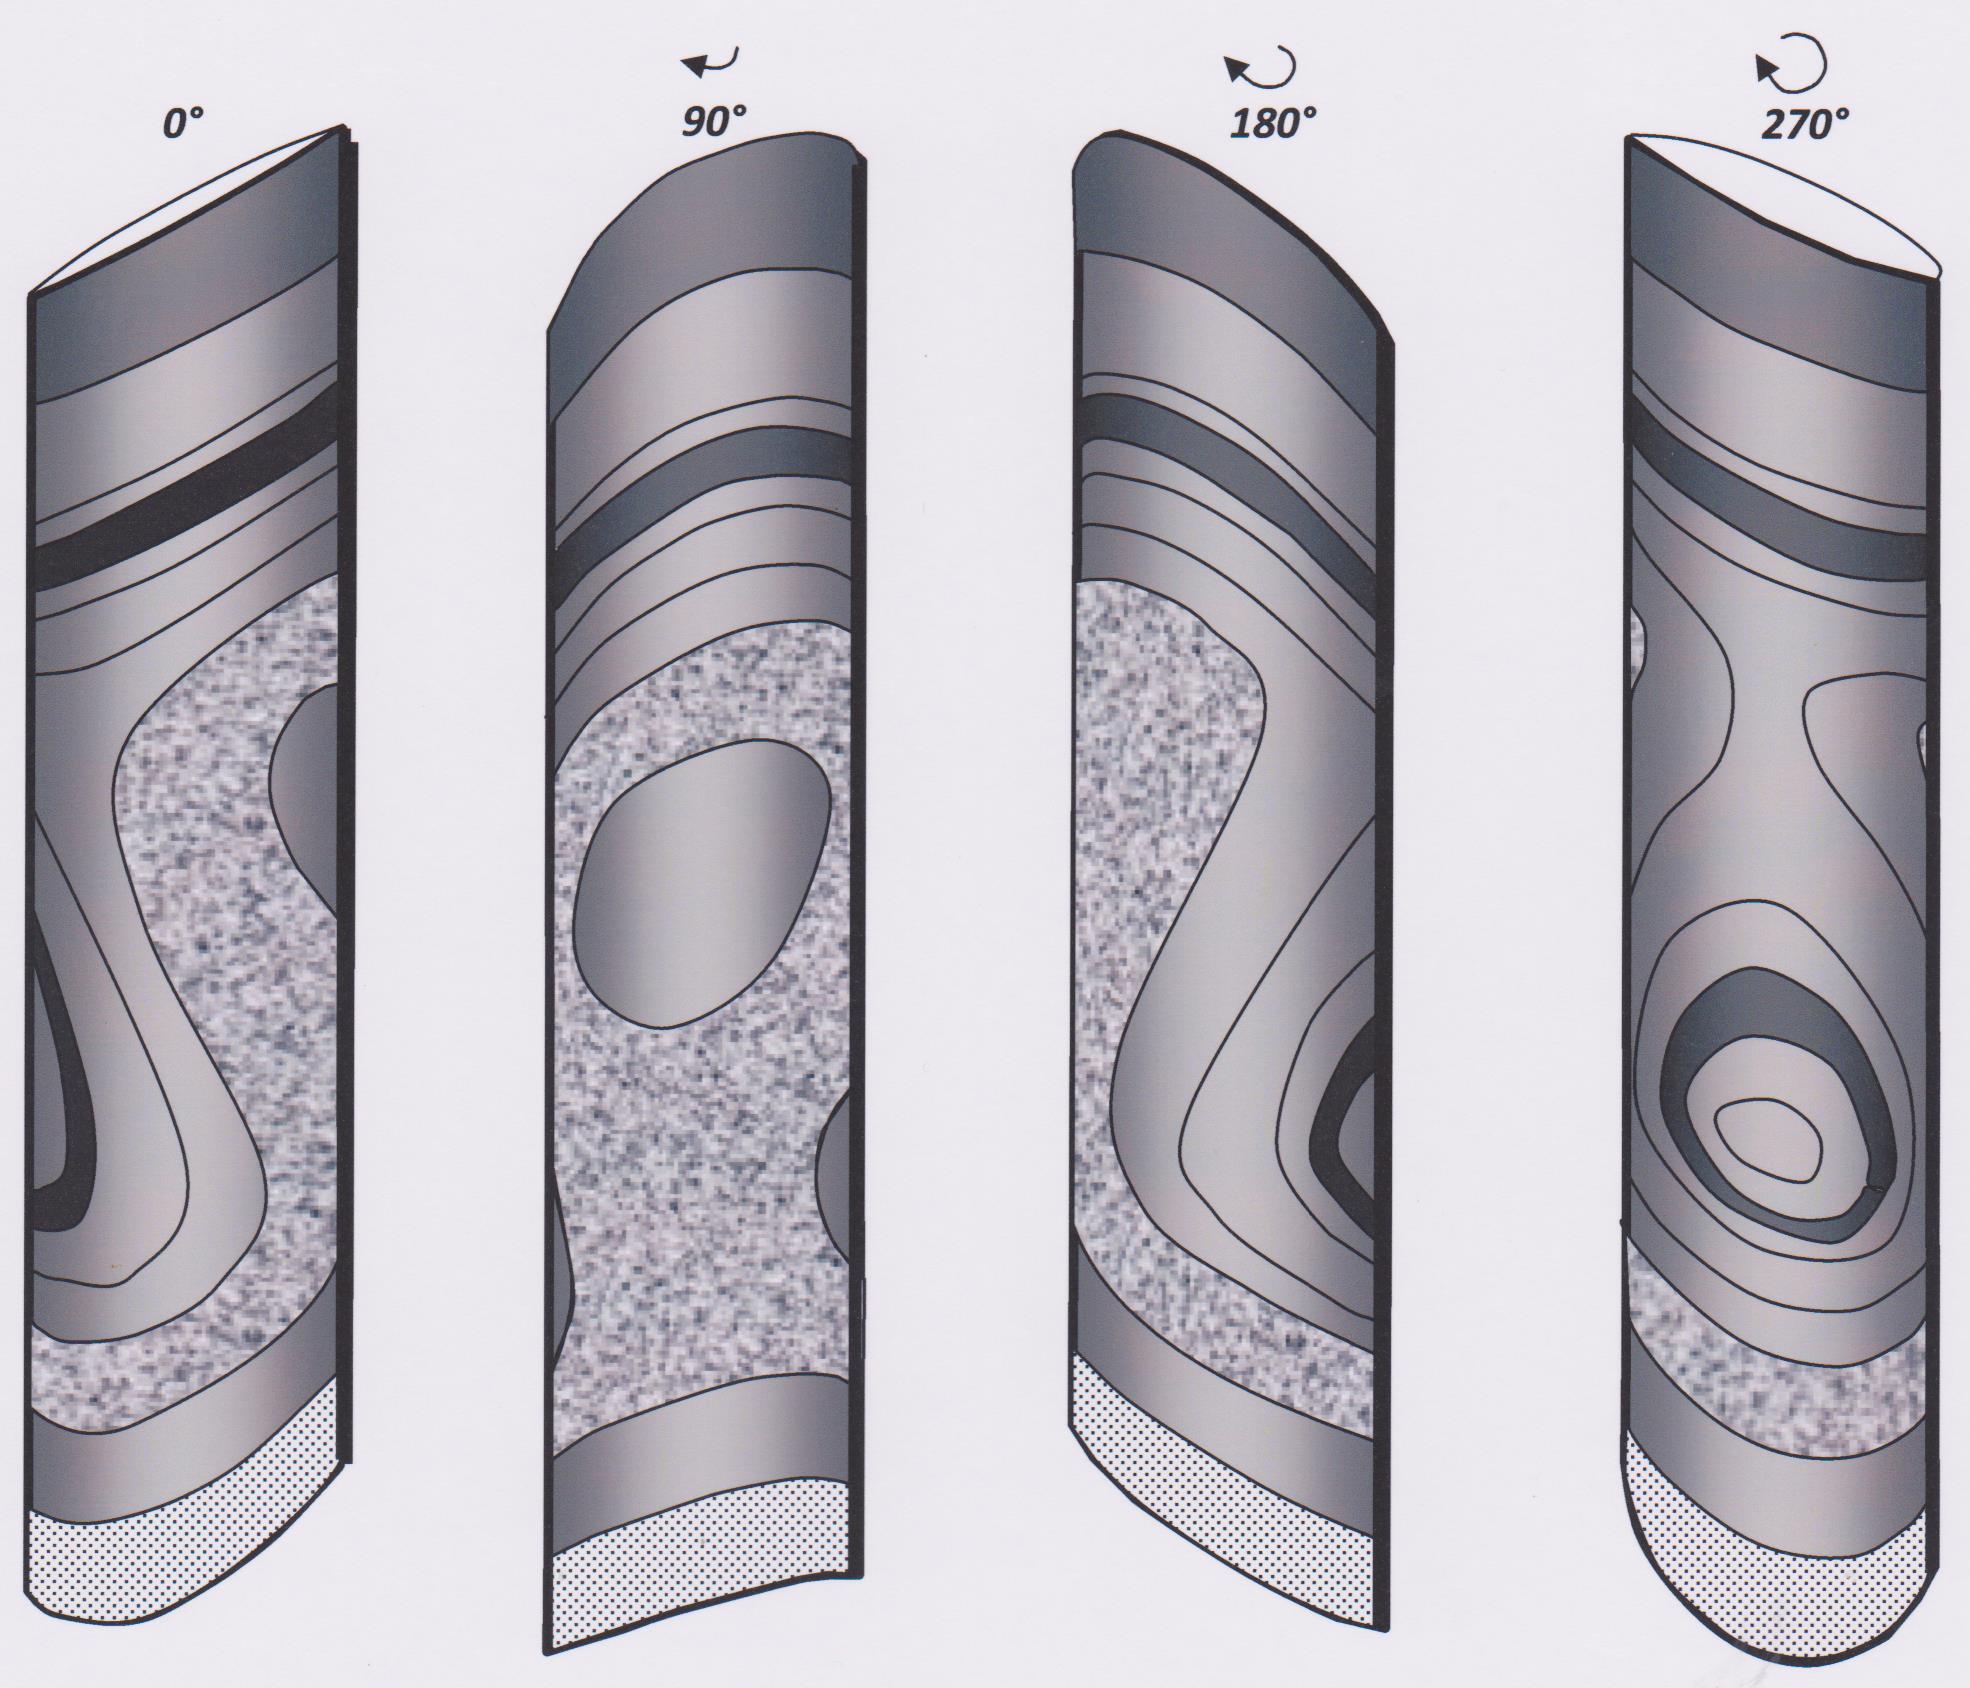
Folds whose amplitude and wave-length are comparable to the diameter of the core can present very complex shapes on the core surface. A parasitic fold pair is illustrated in the figure below, with views of the core from two different angles:
Click on image for full-sized version
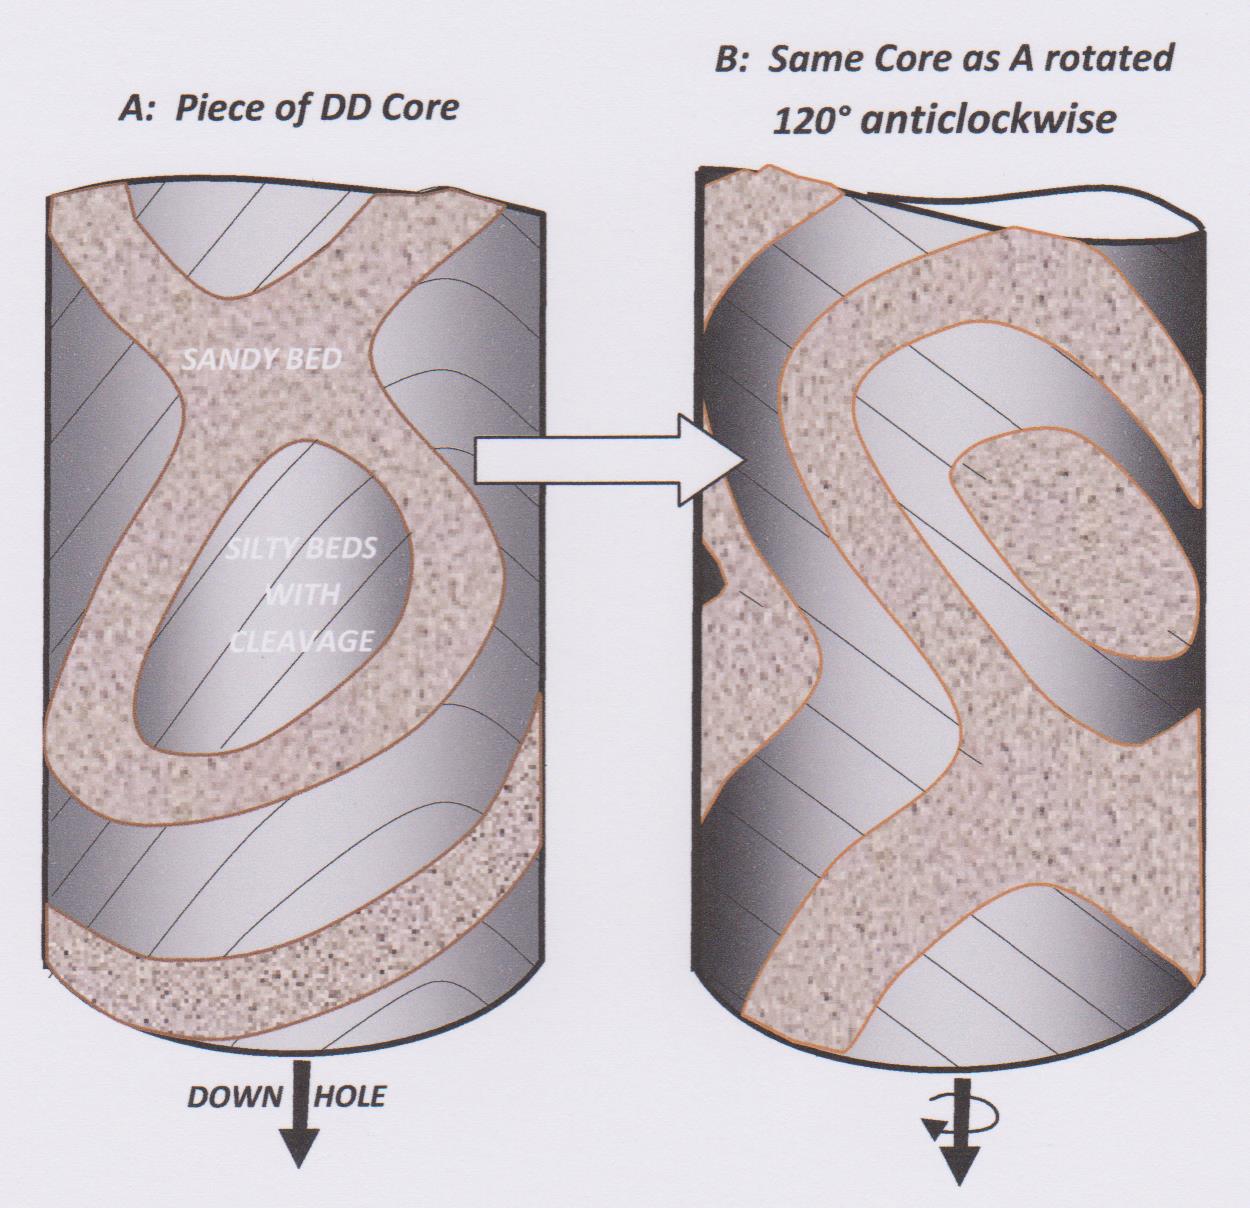
A fold pair is present: it has two long parallel limbs and a short common limb. Considering only position in space then this double fold has three limbs, but in terms of attitude there are only two limbs: the two long parallel limbs are hence both labelled Limb 1 on the diagram, and the short common limb is labelled Limb 2.
The complexity of the shape of the folded sandstone beds is caused by the fact the their trace on the core surface loops and bends around no less than eight inflection points.
Each planar limb intersects the core with a characteristic intersection ellipse and each ellipse, as explained above, has two inflection points E and E’ . That makes four inflection points. The fold axes are defined by the lines of maximum curvature where each of the two long limbs meet the common short limb – this defines two inflection lines and hence four additional inflection points on the core surface where each of the two fold axes enters and leaves the core. Note that the inflection points for the planar limbs are an artefact of the cylindrical exposure surface, while the inflection points for the folds axes are the result of physical folding of the sandstone beds during tectonism, but at first glance their effect on the trace of the sandstone bed can appear the same.
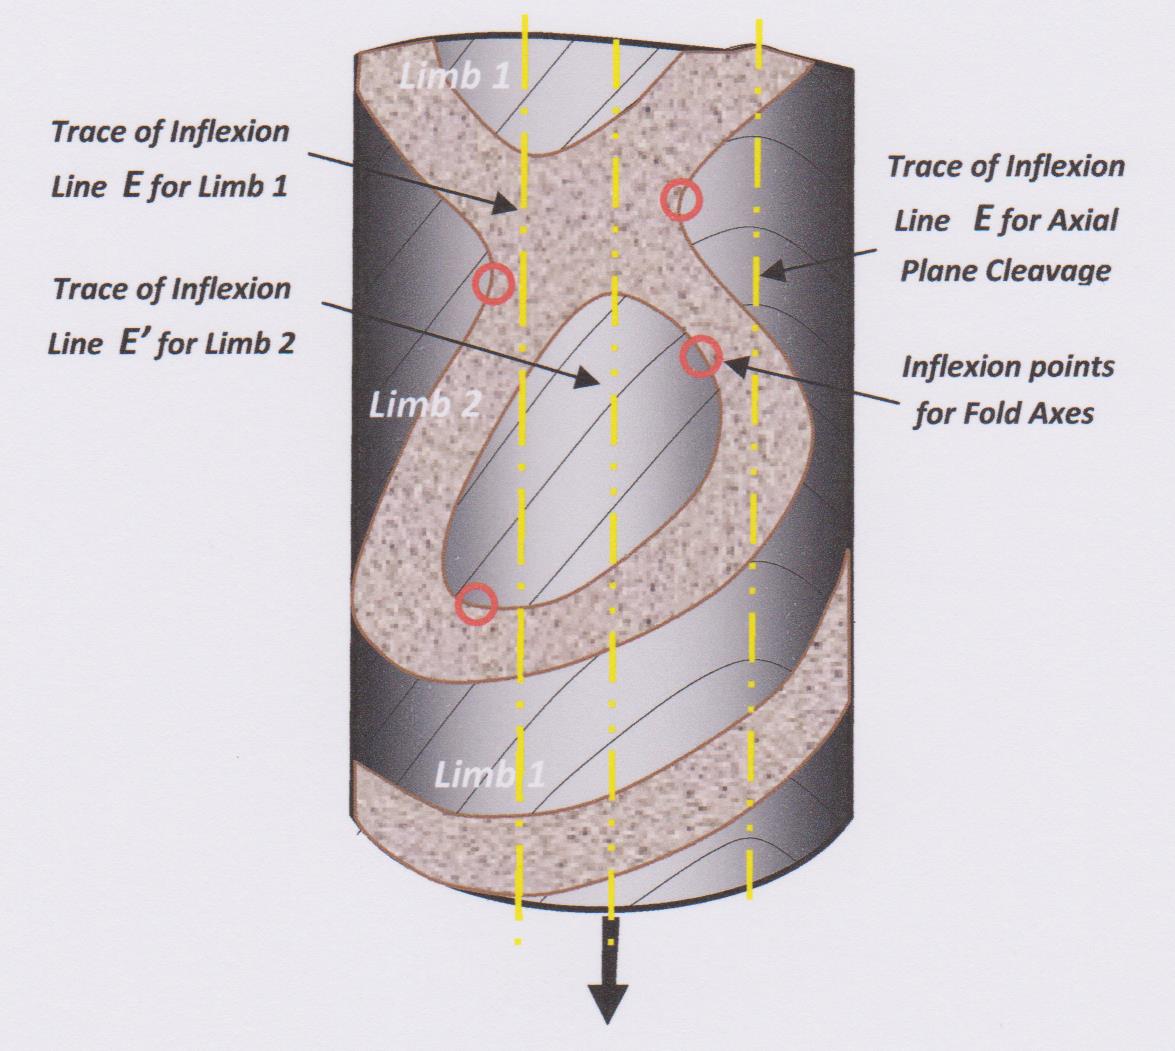
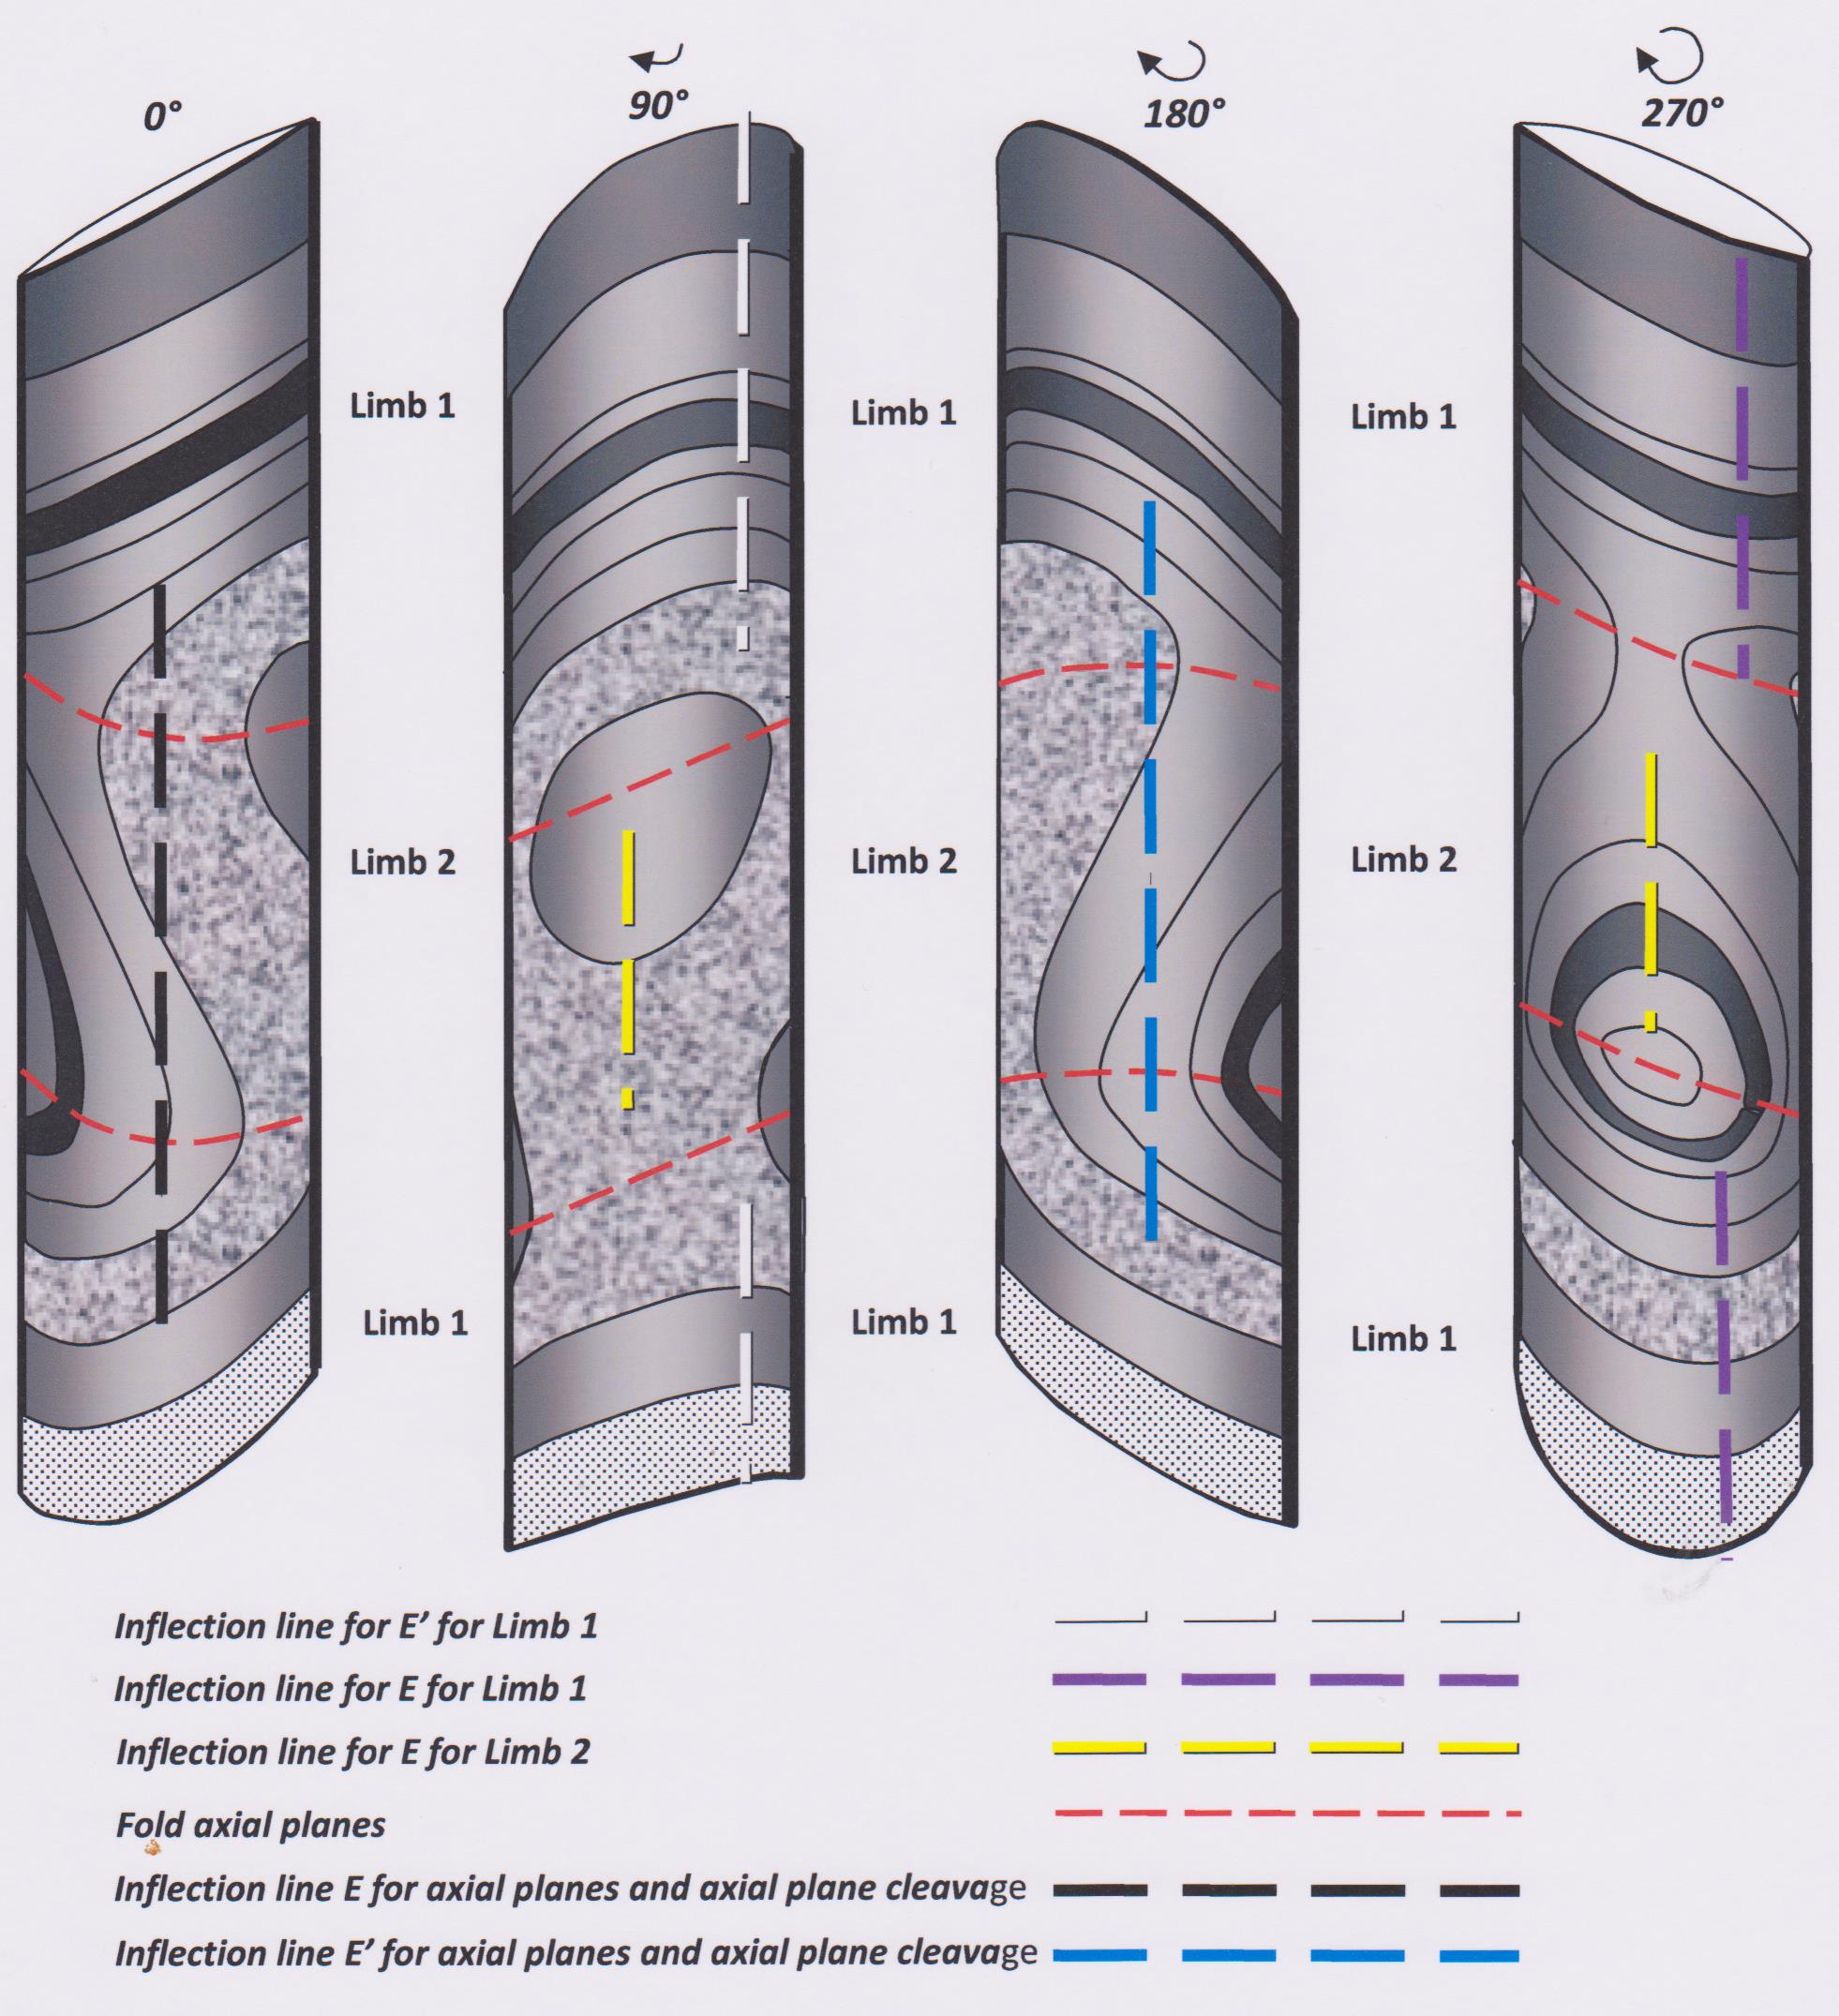
To analyse what is happening in this piece of core it is necessary to pick it up and examine it from various angles, carefully tracing the folded beds around the various inflection points. A true profile view of the fold is obtained when looking exactly along the fold axes. Once the inflection points have been identified it is possible to analyse the structures by drawing lines along the core to mark the inflection lines for Limb 1 and Limb 2. Normally this would be done mentally, but I have marked these lines on the diagram below. I have also marked the inflection line for the axial plane cleavage. The inflection points where the fold axes enter and leave the core are also identified and marked.
Click on image for full-sized version
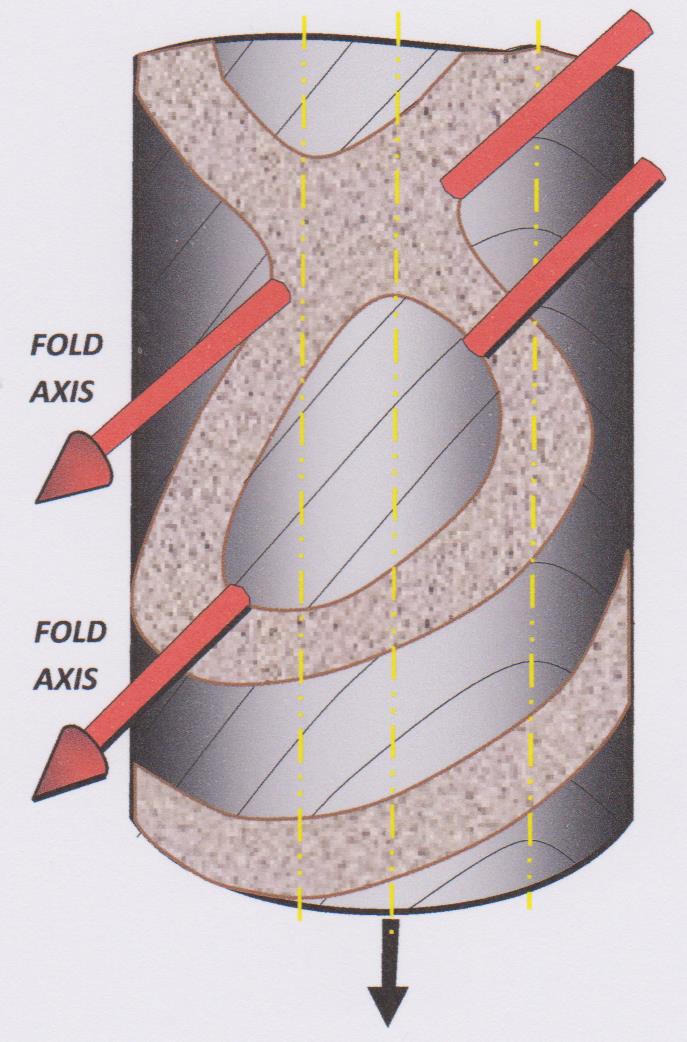
With the fold axis inflection points identified it is possible to mentally join them up to define the two fold axes, as shown by the red arrows, below.
If the core has been fully oriented it is now possible to set the core piece up in a Core Frame, attach extension rods with adhesive putty (i.e. Blu-Tac) to the core surface to mimic the red arrows of the diagram, and measure the trend and plunge of the folds with a geologists’ compass. At this point the vergence of the fold pair can be observed by sighting down the fold axes and can be recorded on the log or Section as a vector (arrow) pointing to a major anticline (or syncline) either up-hole or down-hole (more information on this will be found in my previous blog post : Vergences and Fractals).
In the example illustrated it is not possible to determine the vergence of the folds because insufficient core orientation data is provided (merely knowing the down direction of the core axis is not enough).
Click on image for full-sized version
This has become a very long post, but if you have read so far you will have become skilled at interpreting the appearance of lines and planes and folds in DD core. Now try out these skills on the final example below:
For full size version click on image. All illustrations based on tracings made from photographs of HQ diameter (63.5mm) drill core.
Note that this blog no longer accepts comments (there was too much spam coming in). If you want communicate with me please use the email contact form in the Contacts tab.
[1] The idea of a fractal dimension was first developed by Benoit Mandelbrot in the 1970s (the one who discovered the famous Mandelbrot Set). I discuss fractal dimensions in more detail in my Blog post “Vergences and Fractals”.