The Three Point Problem
In a previous post (see here) I described how quantitative orientation data can be collected from from a single drill hole, even where the core is not oriented. In this post, techniques for collecting orientation data on planes are described when more than one non-oriented hole is available from a prospect.
The need to determine the strike and dip of a planar structure from a number of drill intersections is one that occurs very frequently – this is often called the three-point problem[1] and every geologist should be familiar with the simple solutions to it (Marjoribanks, 2007).
The attitude of any plane is fully defined if the position in 3D space of three or more points on that surface is known. Where three separate holes intersect the same marker bed, they provide three points of known position on that surface. From the intercept data, there are three ways of calculating the strike and dip. The first makes use of structure contours. The second involves the use of a stereonet. In the presentation of the solutions below, it is assumed that the bed to be measured has the same attitude in all three holes.
There is, of course, the third way: feed the numbers into a computer program such as the freeware you can download at www.edumine.com ; then click the button marked “Answer”. The “answer” in this case is useful strike/dip/dip direction information from intersection coordinates. But what matters almost as much as information is the means by which you arrive at it. Graphical manipulation is a mental process that engages your brain in the 3D realities of your measurements, and it is this pre-conditioning that helps you turn mere information into knowledge and understanding. In this case, “Understanding” is the ability to create predictive models for ore, or to cut losses, walk away, and try your luck elsewhere. For this kind of understanding, easy shortcuts can be self-defeating.
Remember the mantra, the theme of many of my posts:
Data is not information
Information is not knowledge
Knowledge is not understanding
Understanding is not wisdom
Solution using structure contours.
In figure 1, the intersections of three holes into a common marker bed are projected onto a plan. Proceed as follows:
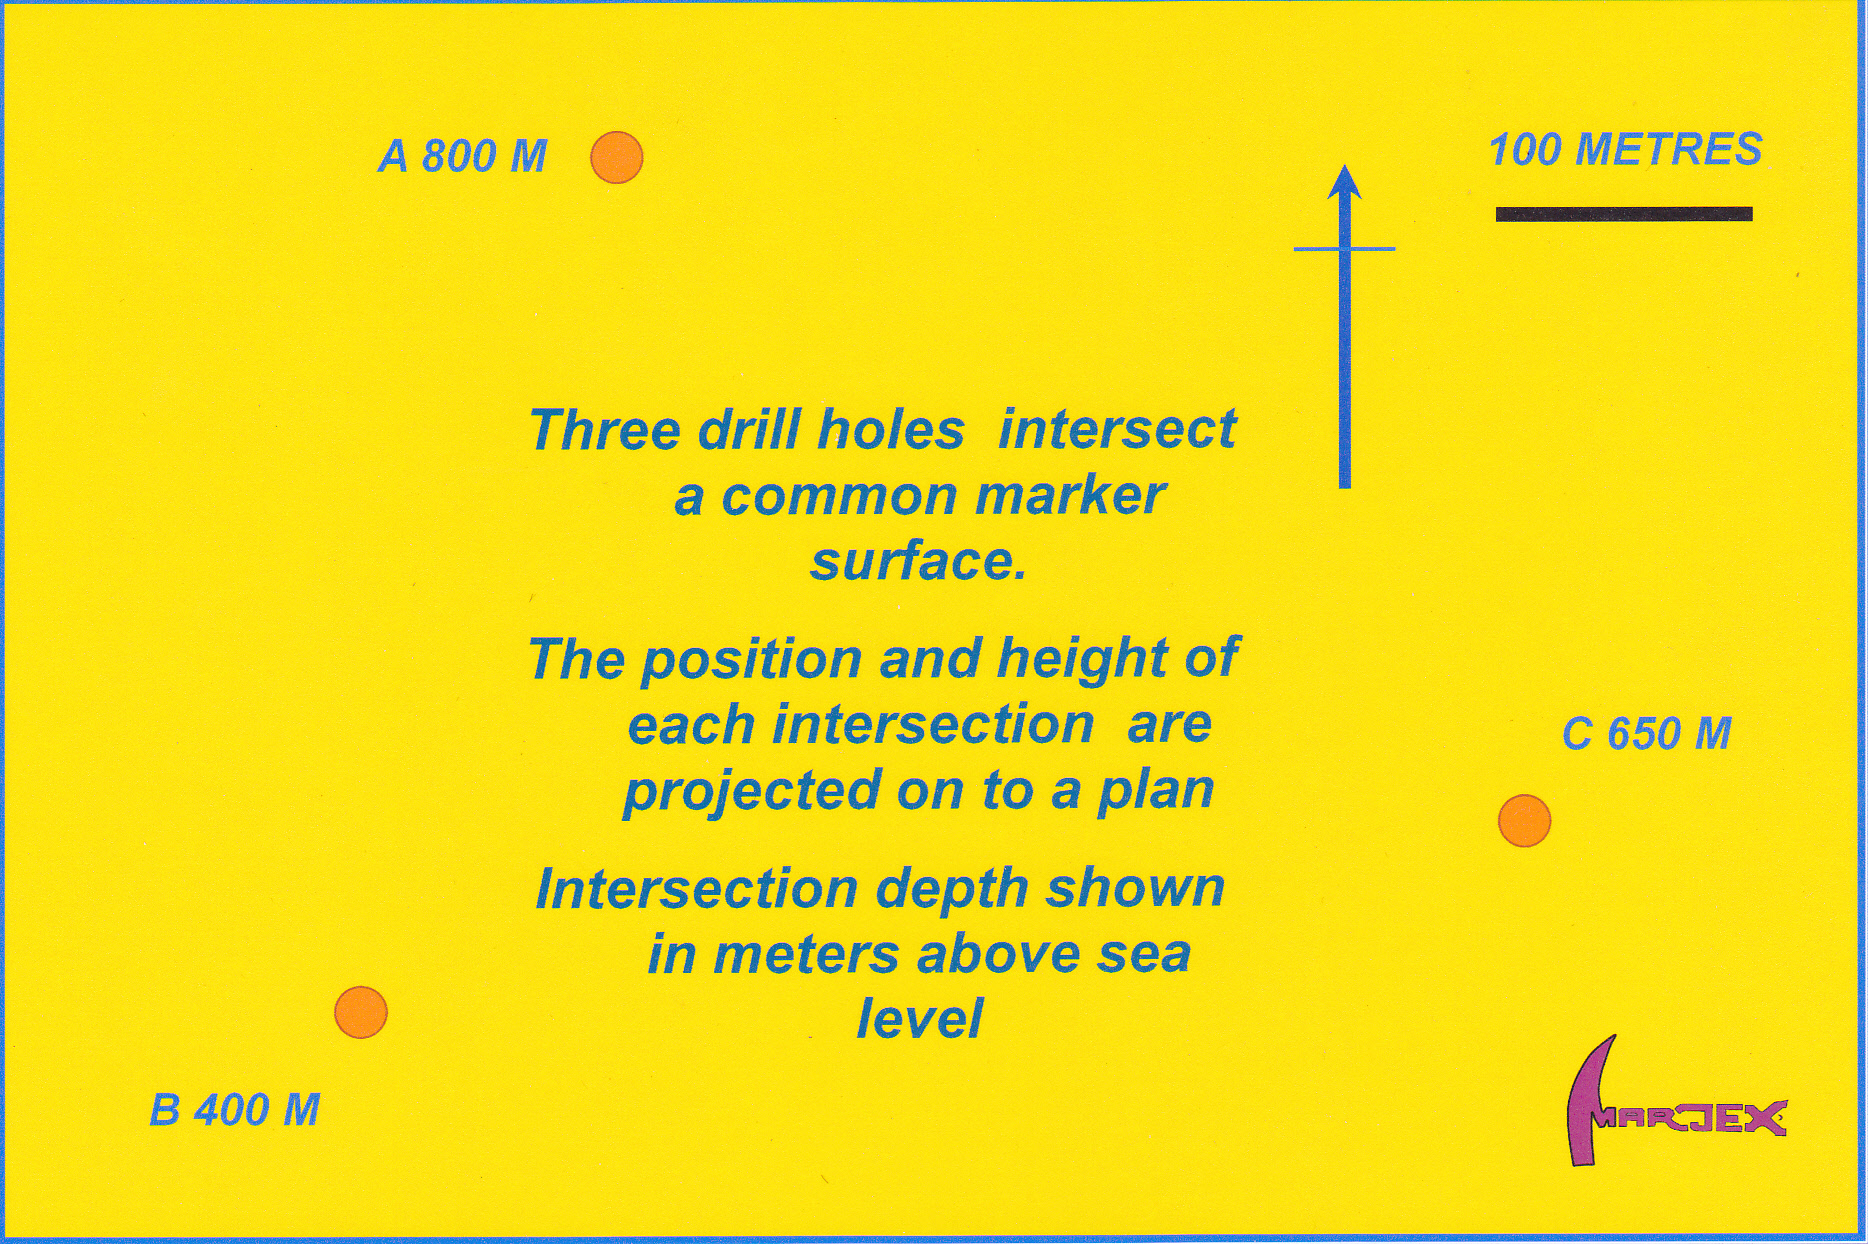
Figure 1 Using structure contours to determine the strike and dip of a planar surface intersected in three drill holes. On the map three drill holes have intercepted a common bed. The intercepts have been projected vertically onto the plan and labelled with their height above a common datum. Click for full size figure.
Step 1
Determine the three-dimensional coordinates (i.e. northing, easting and height above the datum) of each intersection of the marker bed in the holes.
Step 2
Plot the three bed intersection points on a map using the northing and easting coordinates for each intersection. Write the depth (often called the Relative Level, or RL) of the intersection beside each point.
Step 3
On the map draw a lines joining the hole intersections (figure 2). The height of the intersection at the beginning and the end of each line is already marked. Using a ruler, scale off along each line to identify the positions of all intermediate depths: identify and mark even-number depth divisions.
Step 4
Draw the lines joining points of equal depth on the surface. The lines correspond to the height contours on a topographic map and are known as structure contours. They represent the plot of horizontal lines on the bed and thus mark its strike. This strike can then be measured on the map using a protractor.
Step 5
Use the map scale to measure the horizontal distance (h) between any two contour lines – the further apart the better. Since the vertical separation (v) of the contour lines is known, the dip of the surface (d) can be calculated according to the formula:
Tan d = v/h

Figure 2 Constructing lines between each plotted intersection, the position of different heights along the lines can be scaled off. Structure contour lines (dashed) for the bed are constructed by joining points of equal height. These lines define the strike of the surface. From the map scale, the horizontal distance between lines of known height can be measured – simple trigonometry then allows the dip to be calculated. Click for full size figure.
Solution using a stereonet
Proceed as follows (see figures 3 and 4):
Step 1
Determine the absolute position coordinates (i.e. northing, easting and height above a common datum) of each intersection of the marker bed in the three holes.
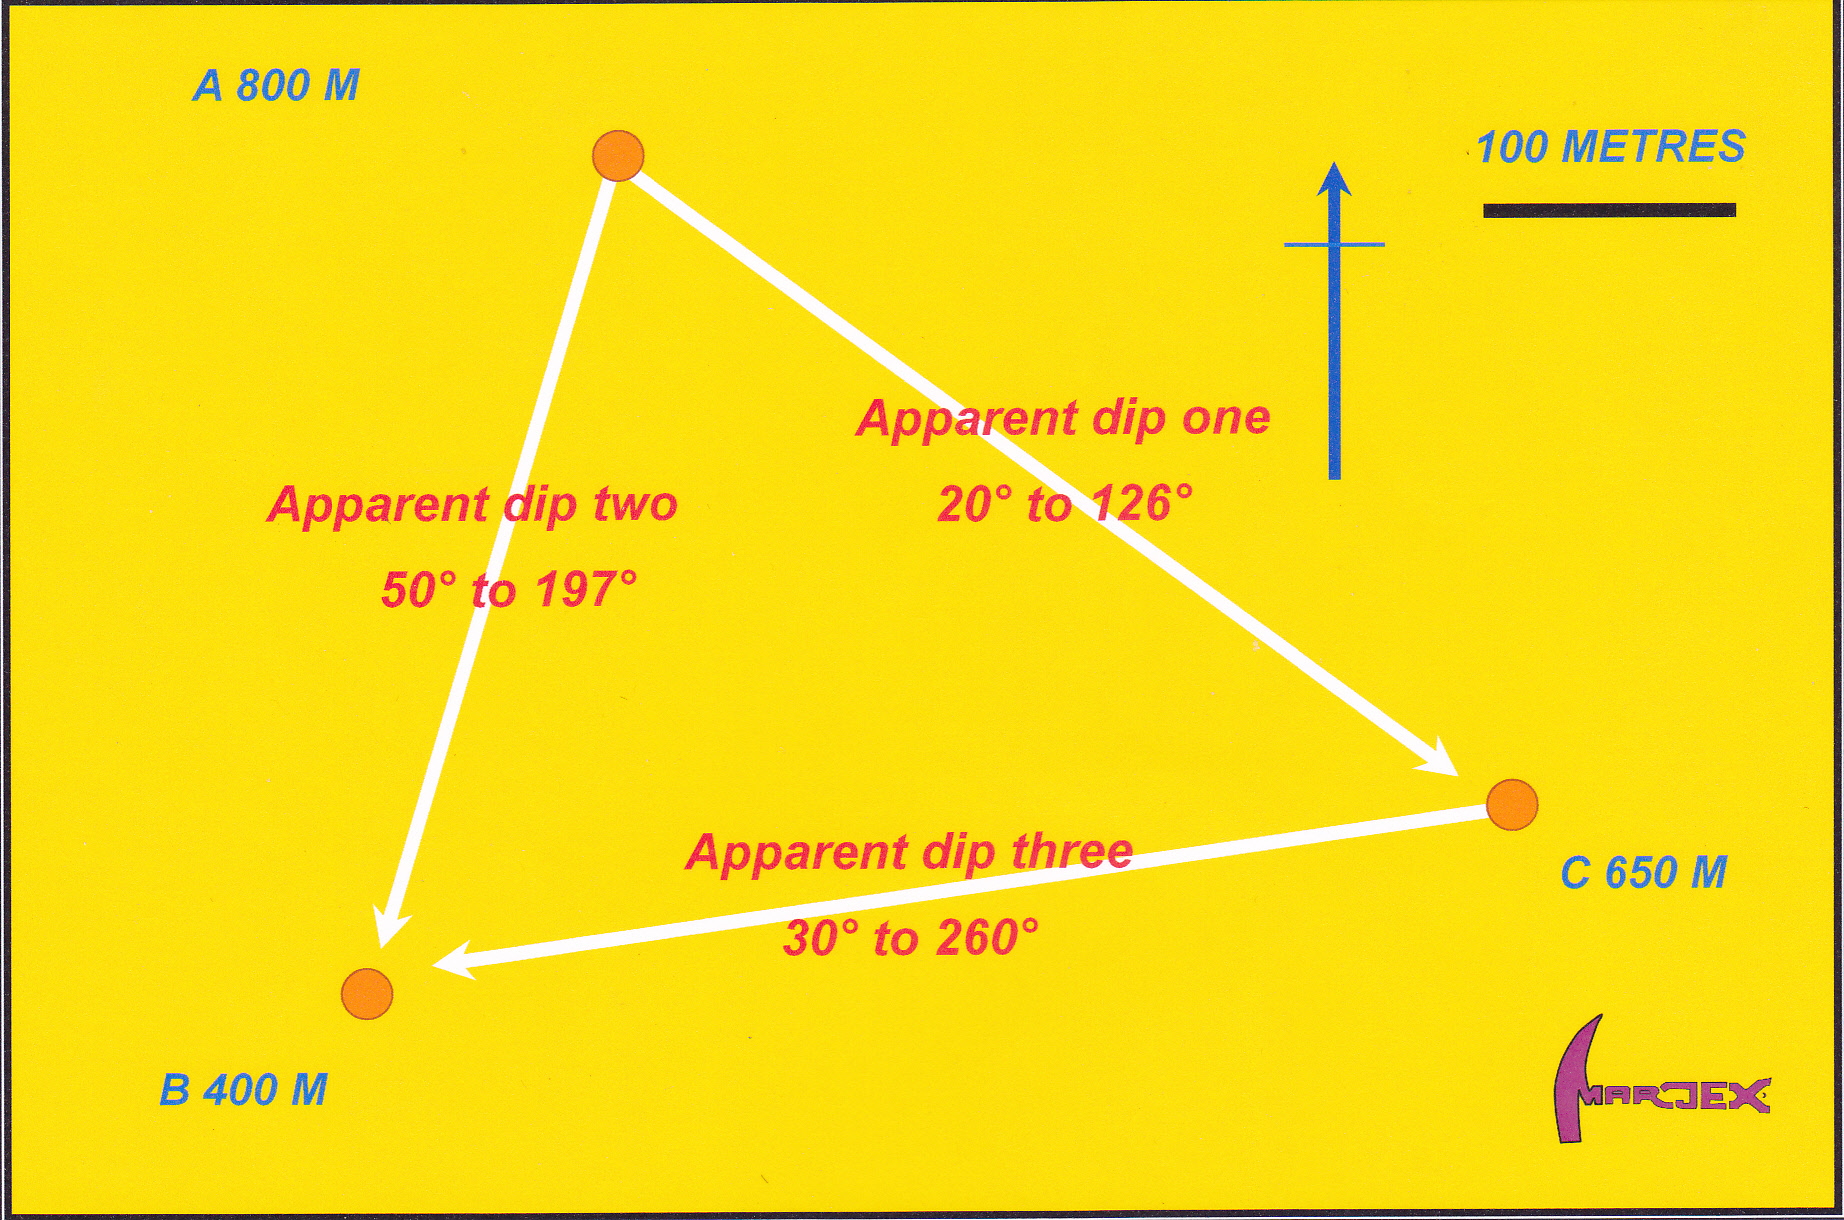
Figure .3 Using a stereonet to determine the strike and dip of planar surface intersected in three drill holes. The intercepts are projected onto a plan and labelled with the height of each intersection above a common datum. The line that joins any pair of intersections is an apparent dip on the bed and can be described by its dip and dip direction. Where v is the vertical height difference between each pair of intersections, and h their horizontal separation, the apparent dip ( a ) can be calculated using Tan a = v/h. The dip direction is measured directly from the plan with a protractor. Three apparent dips can be calculated in this way. Click for full size figure.
Step 2
Plot the three intersection points on a map. Use a protractor to measure the trend (bearing) of the lines joining the three points. Use a ruler to scale off the horizontal distance between the points. Knowing the horizontal and elevation difference between any pairs of intersection points, simple trigonometric formulae (see step 5 above) will provide the angle of plunge (the angle which the line makes with the horizontal, measured in the vertical plane) for the line that joins any two pairs of points.
Step 3
We have now calculated the trend and plunge of three lines lying on the surface of the marker bed. Mark these lines on to a stereonet overlay. They plot as three points, as shown on figure 3.
Step 4
Rotate the overlay so as to bring the three points to lie on a common great circle. Only one great circle will satisfy all three points[2]. This great circle represents the trace of the bed that was intersected by the drill holes.
Step 5
From the net, read off the strike and dip of the surface (or dip and dip direction, or apparent dip on any given drill section).
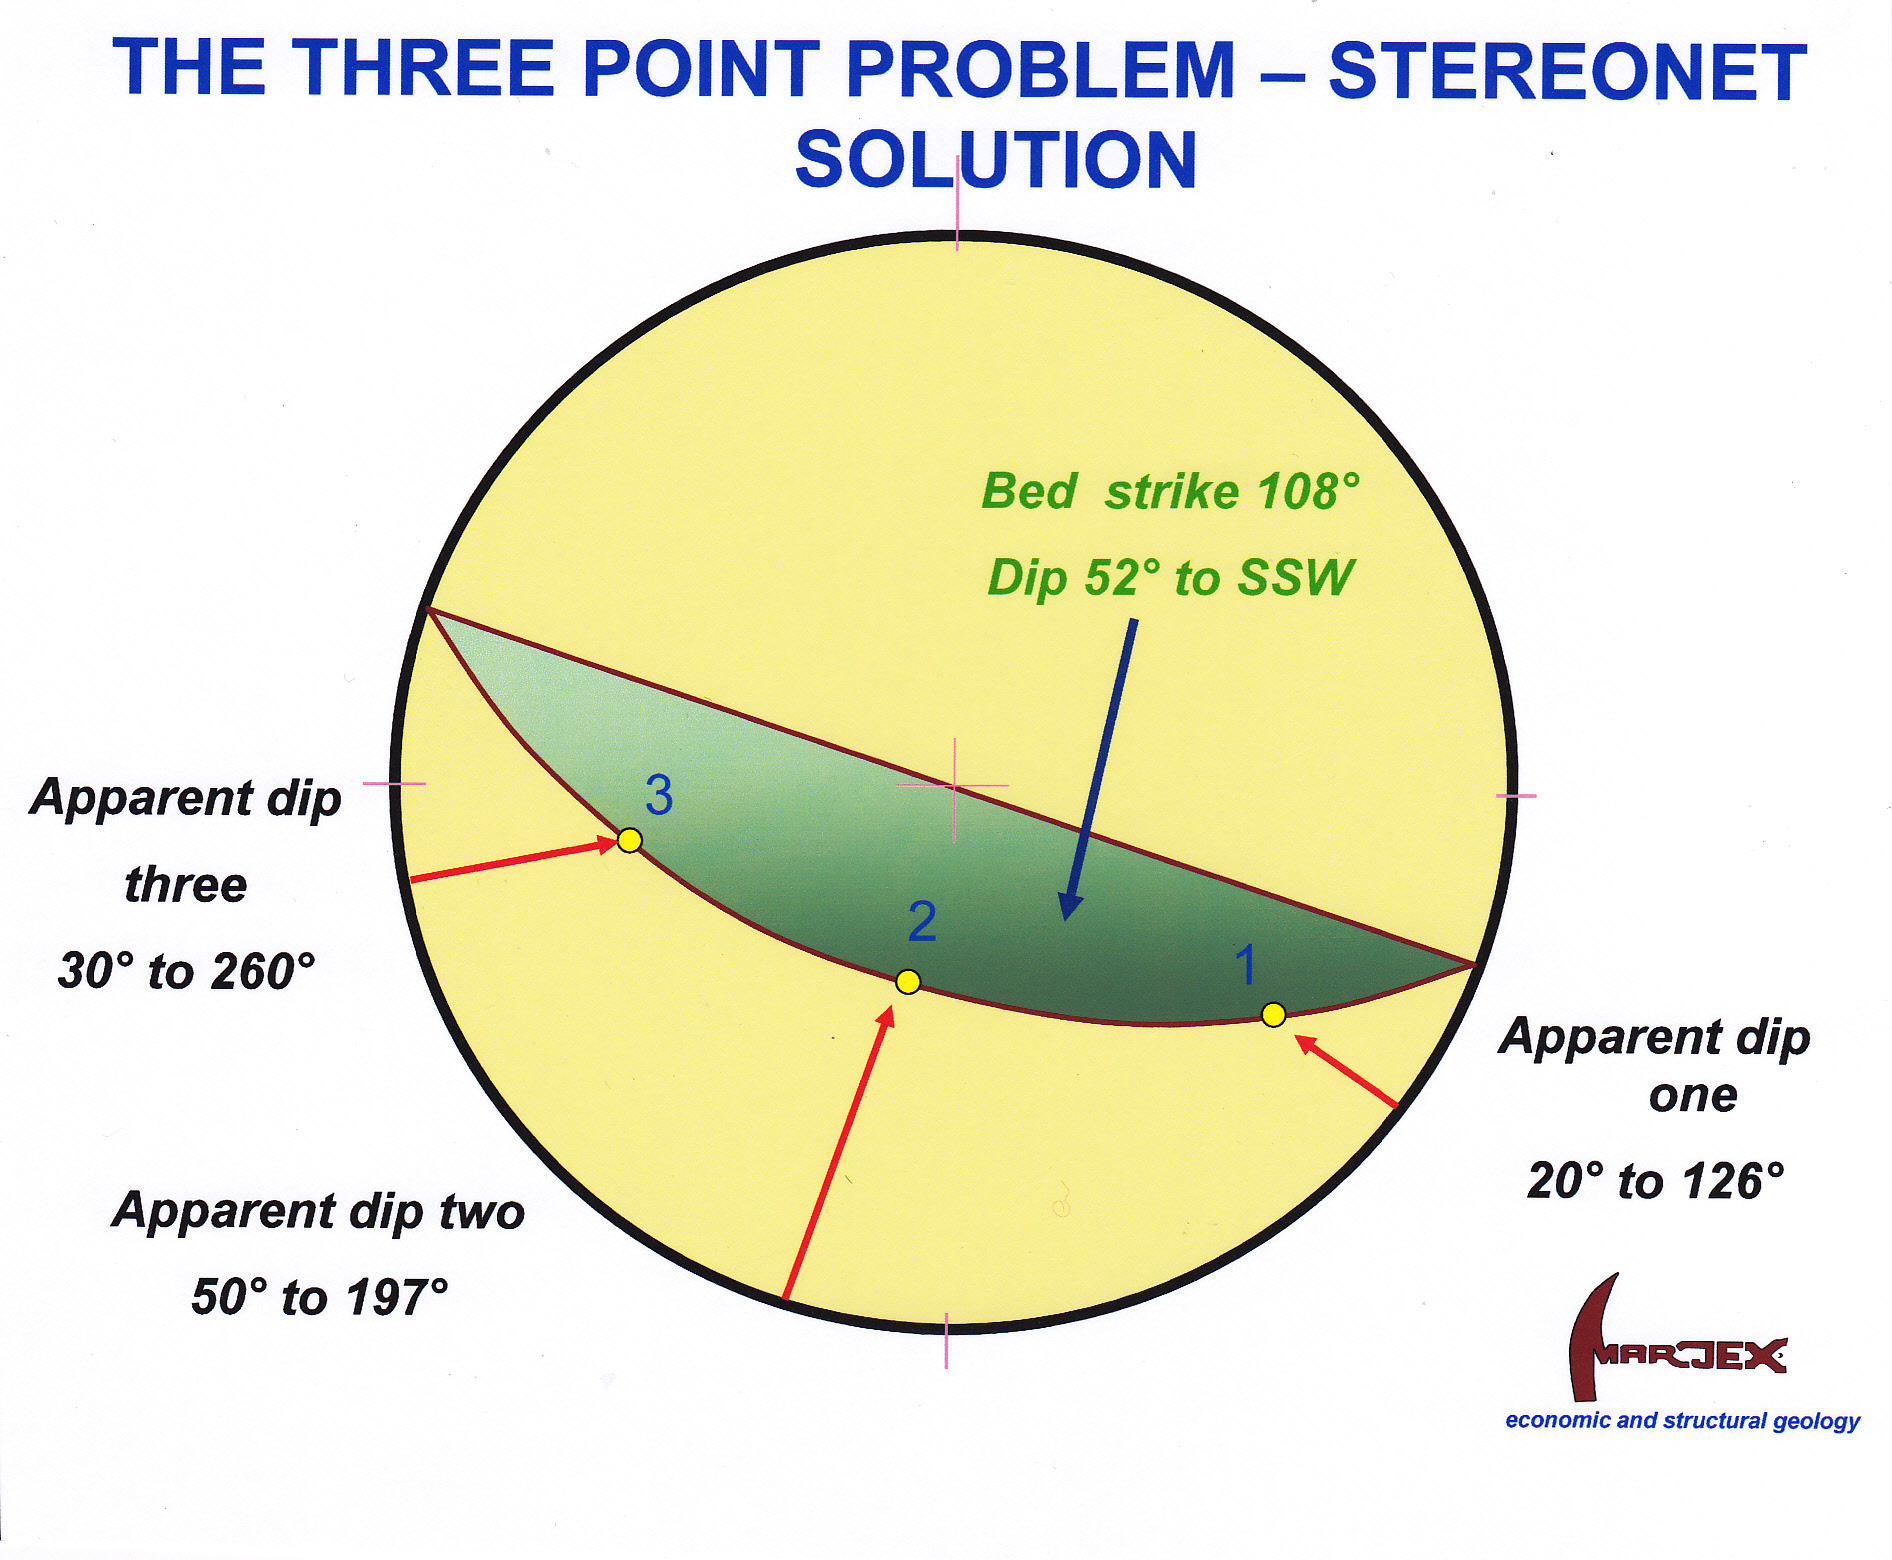 Figure 4 On the stereonet, the three apparent dips plot as three points. The net overlay is rotated to bring the points to lie on a great circle girdle. This girdle is the plot of the bed and its strike and (true) dip can be easily read off. (Actually, only 2 apparent dips are necessary to define the surface, but using a third line provides extra accuracy.) Click for full size figure.
An elegant stereonet solution to determining the attitude of planes in non-oriented core
Where there is no single marker bed that can be correlated between adjacent holes, it is sometimes still possible to determine the orientation of a set of parallel surfaces (such as bedding planes, a cleavage, or a vein set) provided that the surfaces have been cored by a minimum of three nonparallel drill holes (Mead, 1921, Bucher, 1943). The same technique can even be extended to a single hole, provided that the hole has sufficient deviation along its length for the differently oriented sectors of the same hole to be considered in the same way as three separate holes (Laing, 1977).
In the example illustrated in the following figures, three adjacent but non-parallel angle holes have intersected the same set of parallel, planar quartz veinlets. None of the core is oriented, but the average alpha (α) angle (for definition of alpha angle see here) between the veins and the core axis has been measured in each hole: it is 10° in Hole 1; 56° in Hole 2 and 50° in Hole 3.
In our example, Hole 1 is drilled at -50° to 270°; Hole 2 at -65° to 090° and Hole 3 at -60° to 345°. On the stereonet, the orientation of each drill hole plots as a point.
When plotting planes on a stereonet it is always much easier to work with the pole[3] to the plane rather than the plane itself. If a plane makes an angle α with the core axis, then the pole to the plane makes an angle of 90 – α to the core axis, as illustrated in figure 5.
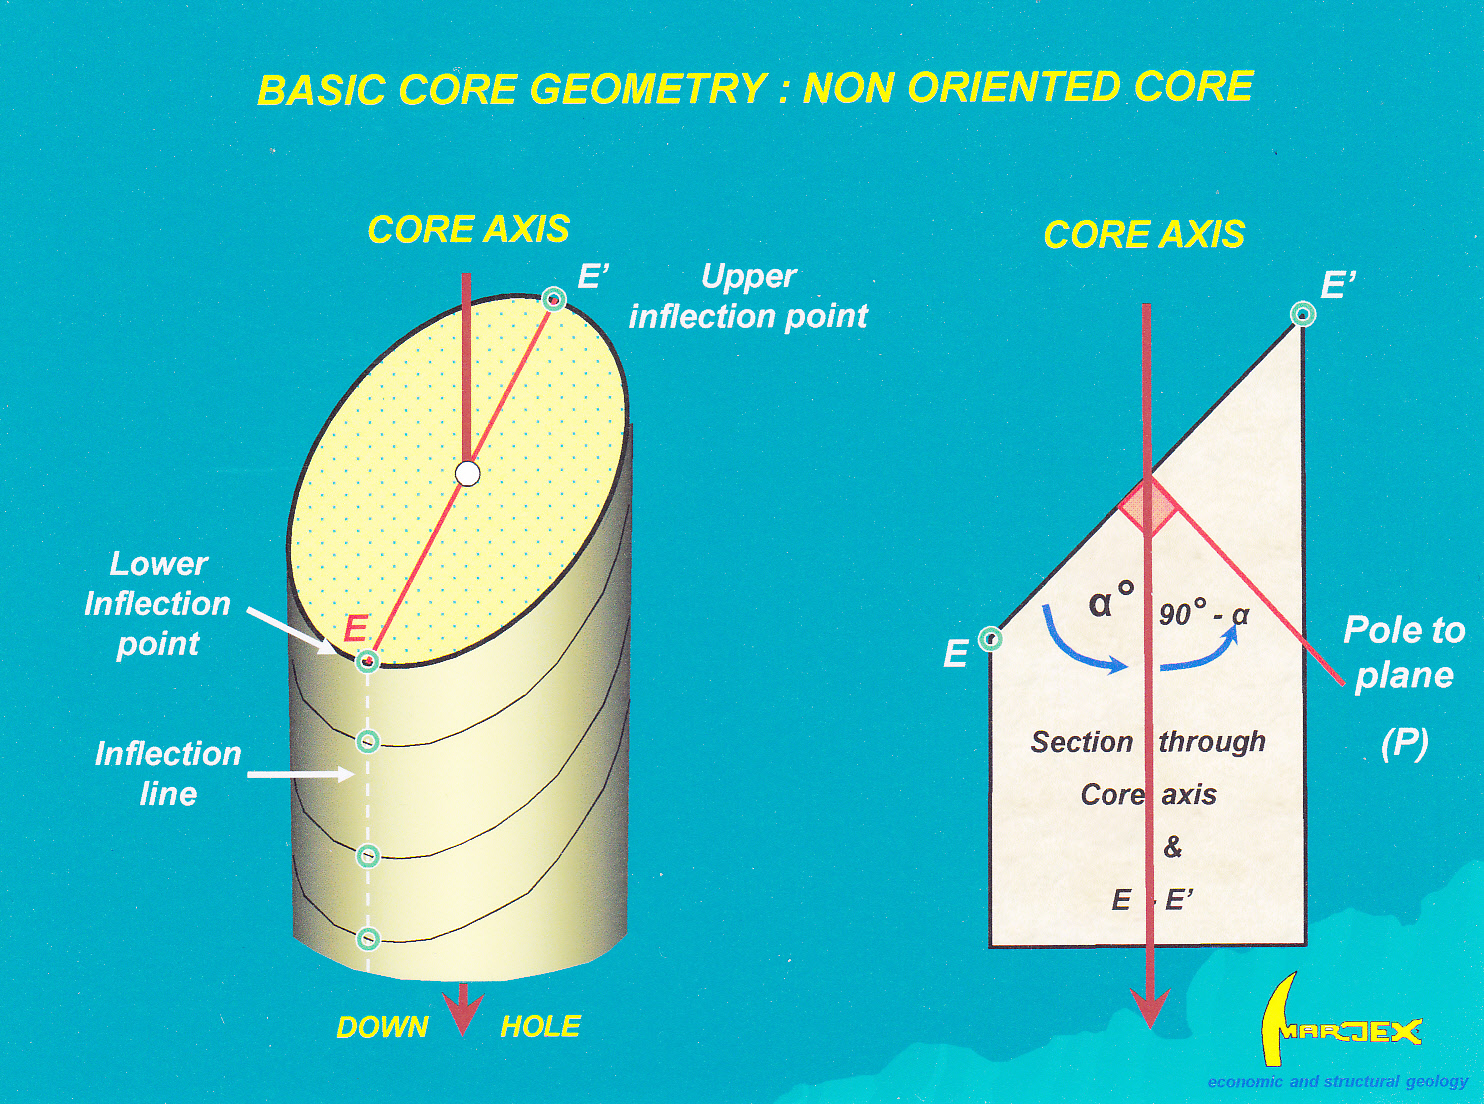
Figure.5 The angular relationship of the alpha angle (α) to the pole (i.e. the normal) of a surface intersected in drill core. Click for full size figure.
Let us consider Hole 1 (figure 6). Angle α for the vein set is known. Because the core is not oriented, the poles to the veins could lie anywhere within the range of orientations that is produced as the core is rotated one complete circle about its long axis. This range defines a cone, centered on the core axis, with an apical angle of 2 x α. From figure 5, we see that the pole to the plane will describe a cone with an apical angle of 2 x (90 – α). That is all we can tell from one hole, but this information can be shown on the stereonet, because a cone centered on a drill hole plots as a small circle girdle around that hole. In Hole 1, 90 – α is 80°. The vein set in Hole 1 can therefore be represented by a small circle girdle at an angle of 80° to the hole plot.
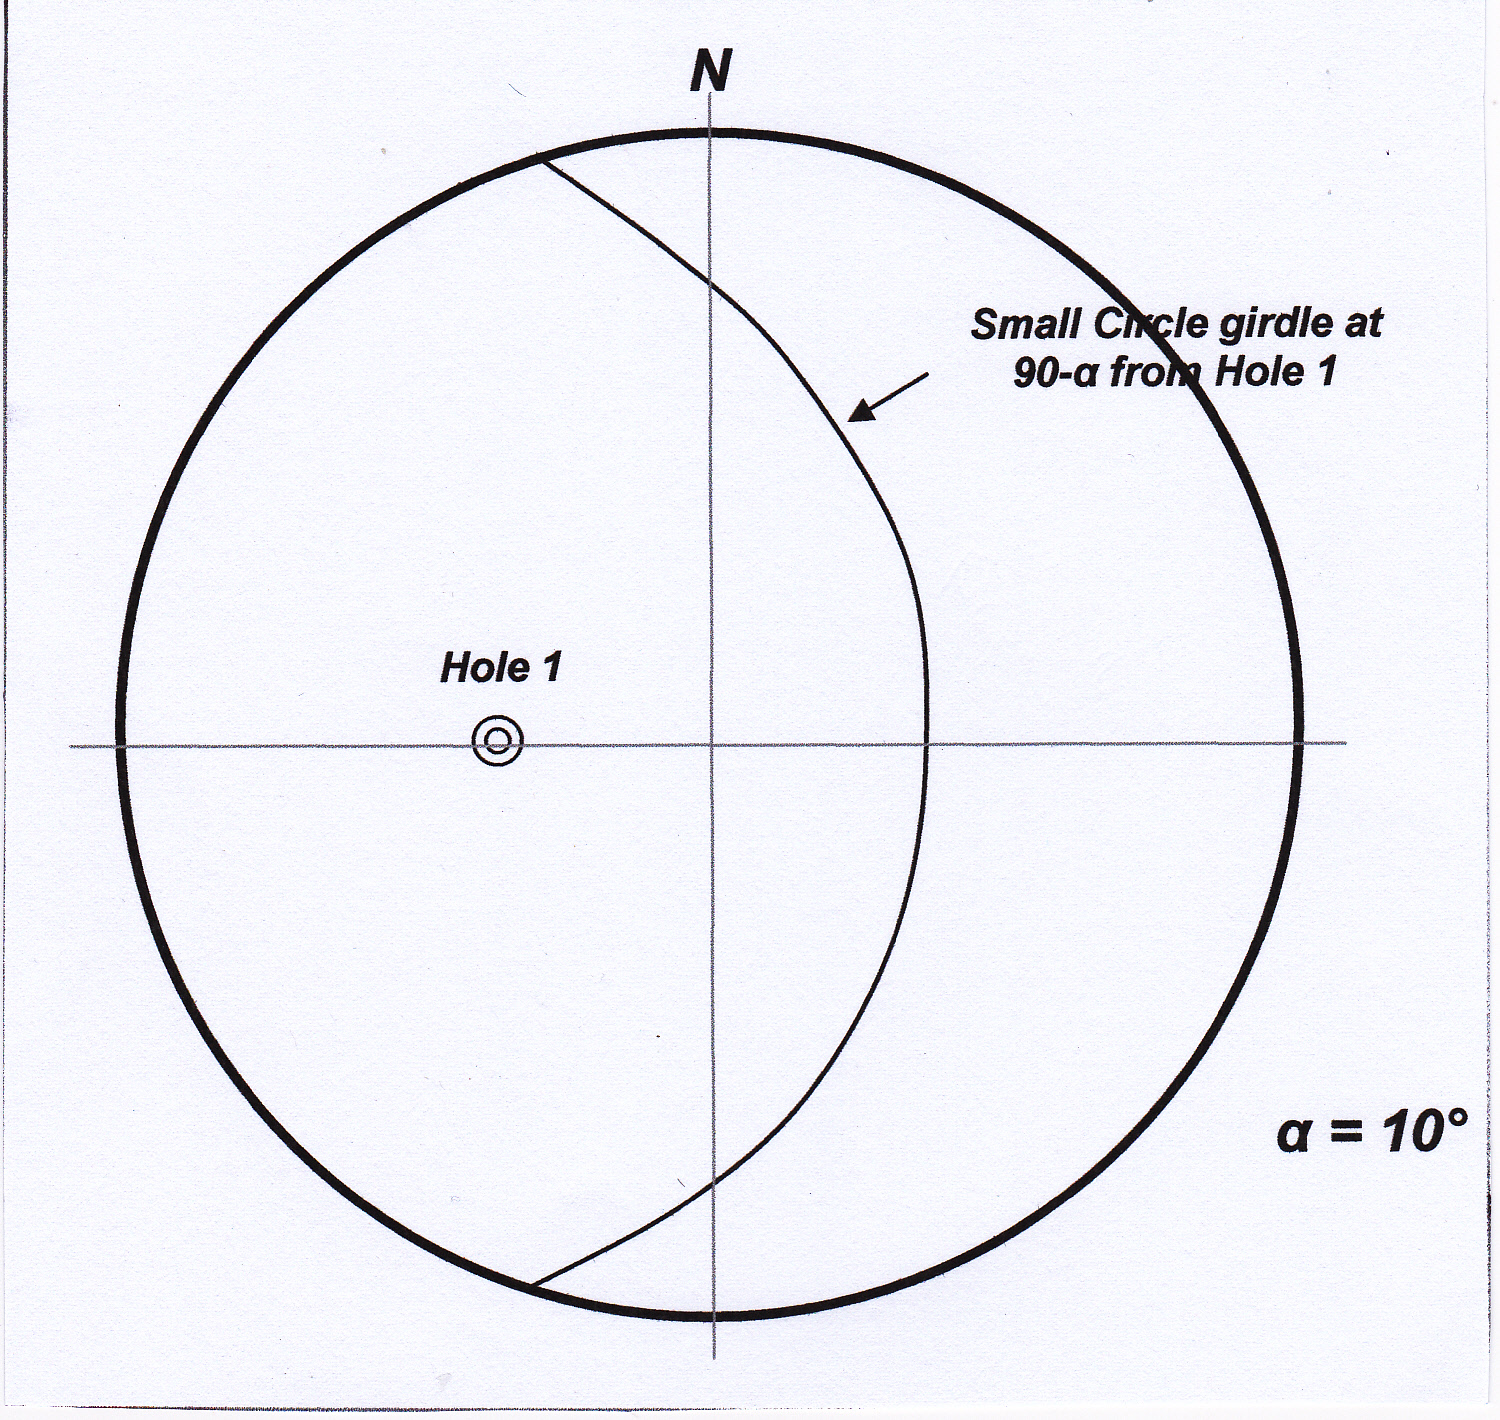 Figure 6 On the stereonet a small circle girdle at 90-α degrees from Hole 1 traces all possible orientations of the poles to a vein set making angle of α with the core axis. Click for full size figure.
Now the same procedure is carried out for Hole 2 by drawing a small circle at 90-α (34°) to the plot of that hole on the net (figure 7). The small circle about Hole 1 and the small circle about Hole 2 intersect at two points (P1 & P2) – these points represent two possible orientations for the vein set. Already, with just two DD holes we have reduced the problem of determining the orientation of the vein set from an infinite number of possibilities to just two possibilities.
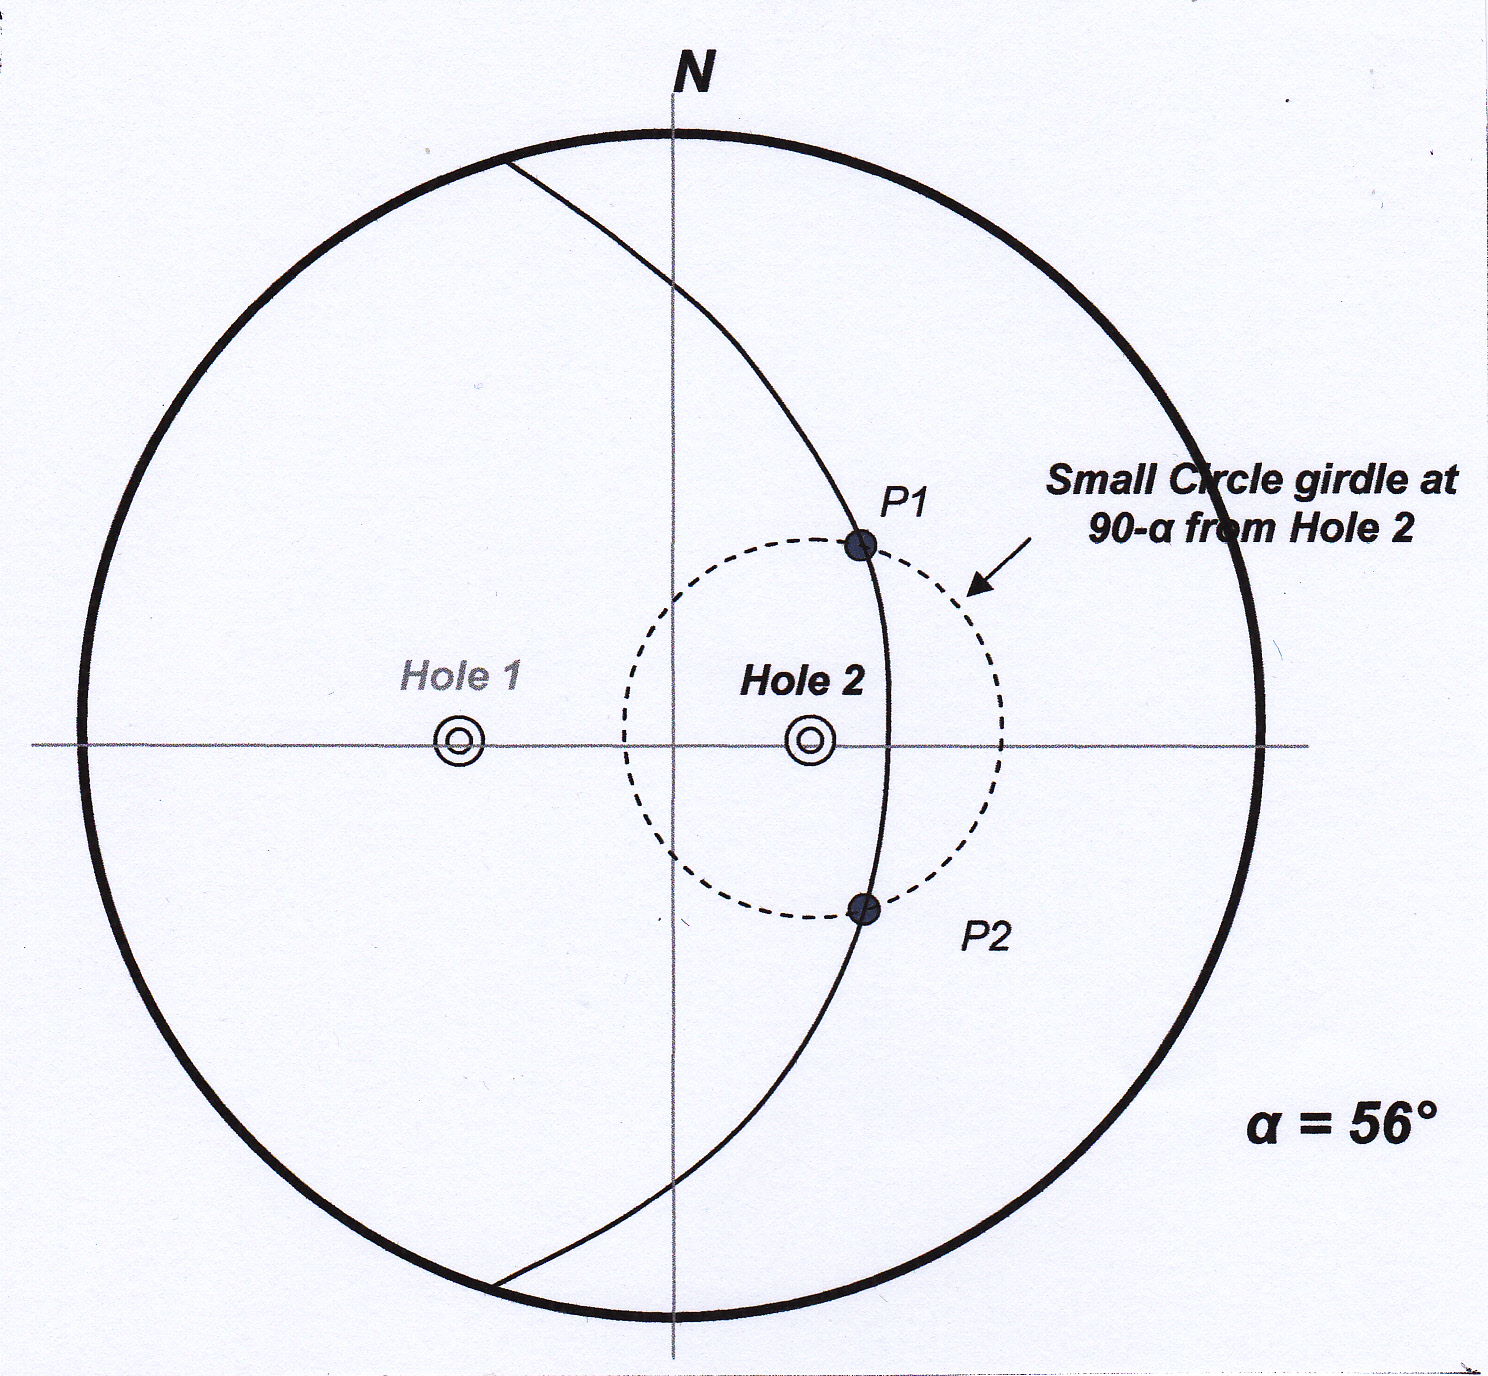 Figure 7 On the stereonet, the poles to all possible planes making an angle of α degrees to the axis of Hole 2 inscribe a small circle girdle at 90-α (34°) to the plot of the hole. The small circle about Hole 1 and the small circle about Hole 2 intersect at two points (P1 & P2) – these points represent the only two possible orientations for the vein set, given the data plotted so far. Click for larger image.
Now, in the same manner, we draw the third small circle about Hole 3 representing the alpha angle measured in that hole (figure 8). We now have three small circle girdles on our net, centered about each of the three drill holes. Since the assumption behind this procedure is that all measurements are of the one vein set with a constant orientation, the single point (P) where the three small girdles intersect must represent the pole to the one orientation that is common to all three holes. This pole defines the attitude of the common vein set seen in the holes. Of course, with a real set of measurements it is unlikely that three small circles plotted in this way would meet at a single point. Rather, the intersecting lines will define a triangle whose size reflects the accuracy of the measurements (and the assumptions made that we are dealing with a single parallel set of surfaces). The true pole position (if there is one) will lie somewhere within this triangle of error.
From the point P, the strike and dip (or dip and dip direction, or apparent dip on drill section) of the vein set can be simply read off from the net.

Figure 8 On the stereonet, the poles to all possible planes making an angle of α degrees to the axis of Hole 3 inscribe a small circle girdle at 90-α (40°) to the plot of the hole. The small circles about Hole 1, Hole2 & Hole 3 intersect at a single P. P is the pole to the unique plane which satisfies the measurements made in the three holes.. Click for larger image.
REFERENCES
Bucher WH (1943) Dip and strike for three not parallel drill holes lacking key beds. Econ Geol 38, 648-657.
Laing WP (1977) Structural interpretation of drill core from folded and cleaved rocks. Econ Geol 72, 671-685.
Marjoribanks RW (2007) Structural logging of drill core. Australian Institute of Geologists Handbook 5 (2nd ed.), 68p.
Mead WJ (1921) Determination of the attitude of concealed bedding formations by diamond drilling. Econ Geol 21, 37-47.
[1] Presumably in a conscious or subconscious nod to Sherlock Holmes’ “3-pipe problem”. In Holmes case, it was an amount of opium, but there is no need to resort to such extreme measures to solve the 3-point problem.
[2] Actually, because a plotted point on a stereonet represents the orientation of a line, only two such points are needed to define the plane on which they lie. The use of a third point (line) adds accuracy and provides for error checking.
[3]The pole to a plane is the line at right angles, or normal, to the plane. By plotting the pole, the attitude of a plane can be represented on a stereonet by a single point.
Note that this blog no longer accepts on-line comments (there was too much spam coming in!). However I welcome all questions, comments or criticisms. You can send these to me via the CONTACT ME tab.