Sense of Movement Structures in Fault Zones : Part 2 – Examples
Within or adjacent to fault zones, various minor associated structures can be present that enable the sense of movement across the fault to be determined. These structures are often called kinematic indicators.
This is the second of three posts (see part 1 and part 3 ) about sense of movement indicator structures in fault zones. In the first part, the theory behind sense of movement indicators is explained and it is recommended that this part be read in conjunction with part 2. This post provides illustrations of sense of movement structures as seen in outcrop and drill core. In Part 3, the criteria for identifying the different classes of structure are tabulated.
Preamble
Knowing the movement that has taken place across a fault makes it possible to predict the location and orientation of tensional zones – and hence potential veins of ore – within or adjacent to the fault.
If the fault is later than the ore body, knowing its movement allows prediction of the location of any mineralisation that may be displaced by it.
Determining the strike of a fault is usually simple. Determining its dip requires some vertical exposure or drill hole information. However, to completely define a fault, it is necessary to know the movement (or displacement) vector and the amount of movement that has taken place between the two sides of the fault.
For all these reasons, knowing the sense of movement on a fault is of the greatest importance.
Some cautionary words
1. Faults develop over time through the accumulation of hundreds of relatively small movements. Although these will add up to a final overall displacement vector, at any given point in a fault zone it is possible to find the preserved evidence for a short term or localised movement that might contradict the overall displacement. You would be unlucky if the one indicator you found happened to be one of these outliers, but nevertheless, many separate observations of kinematic indicators are needed before you can be absolutely certain of the overall displacement.
2. Remember also that many faults are re-activated by successive tectonic events, and later movements may be completely different to earlier ones. As a general rule, movement indicators seen in a rock will reflect only the latest phase of movement that has taken place, but like all rules, there are always exceptions.
3. Rock structure is 3-dimentional, but most structures seen in field exposure or on maps and sections are observed on two-dimensional surfaces that are randomly-oriented with respect to the structure. When interpreting sense of movement structures it must be borne in mind that a 2-D surface is only capable of showing the resolved component of movement on that surface. The true movement direction (the movement vector) may lie at any angle to that surface. To determine the true movement direction it is necessary to have some idea of the 3-D shape of the structure. This is best done by observing the structure on several differently oriented planes.
4. All the examples shown in this post (with the exception of “M“) show structures observed in the plane of maximum movement i.e. the plane containing the greatest and least stress axes for that deformation (see Part 1) or else in a view looking directly at the fault face (a very common type of natural exposure).
Brittle Structures

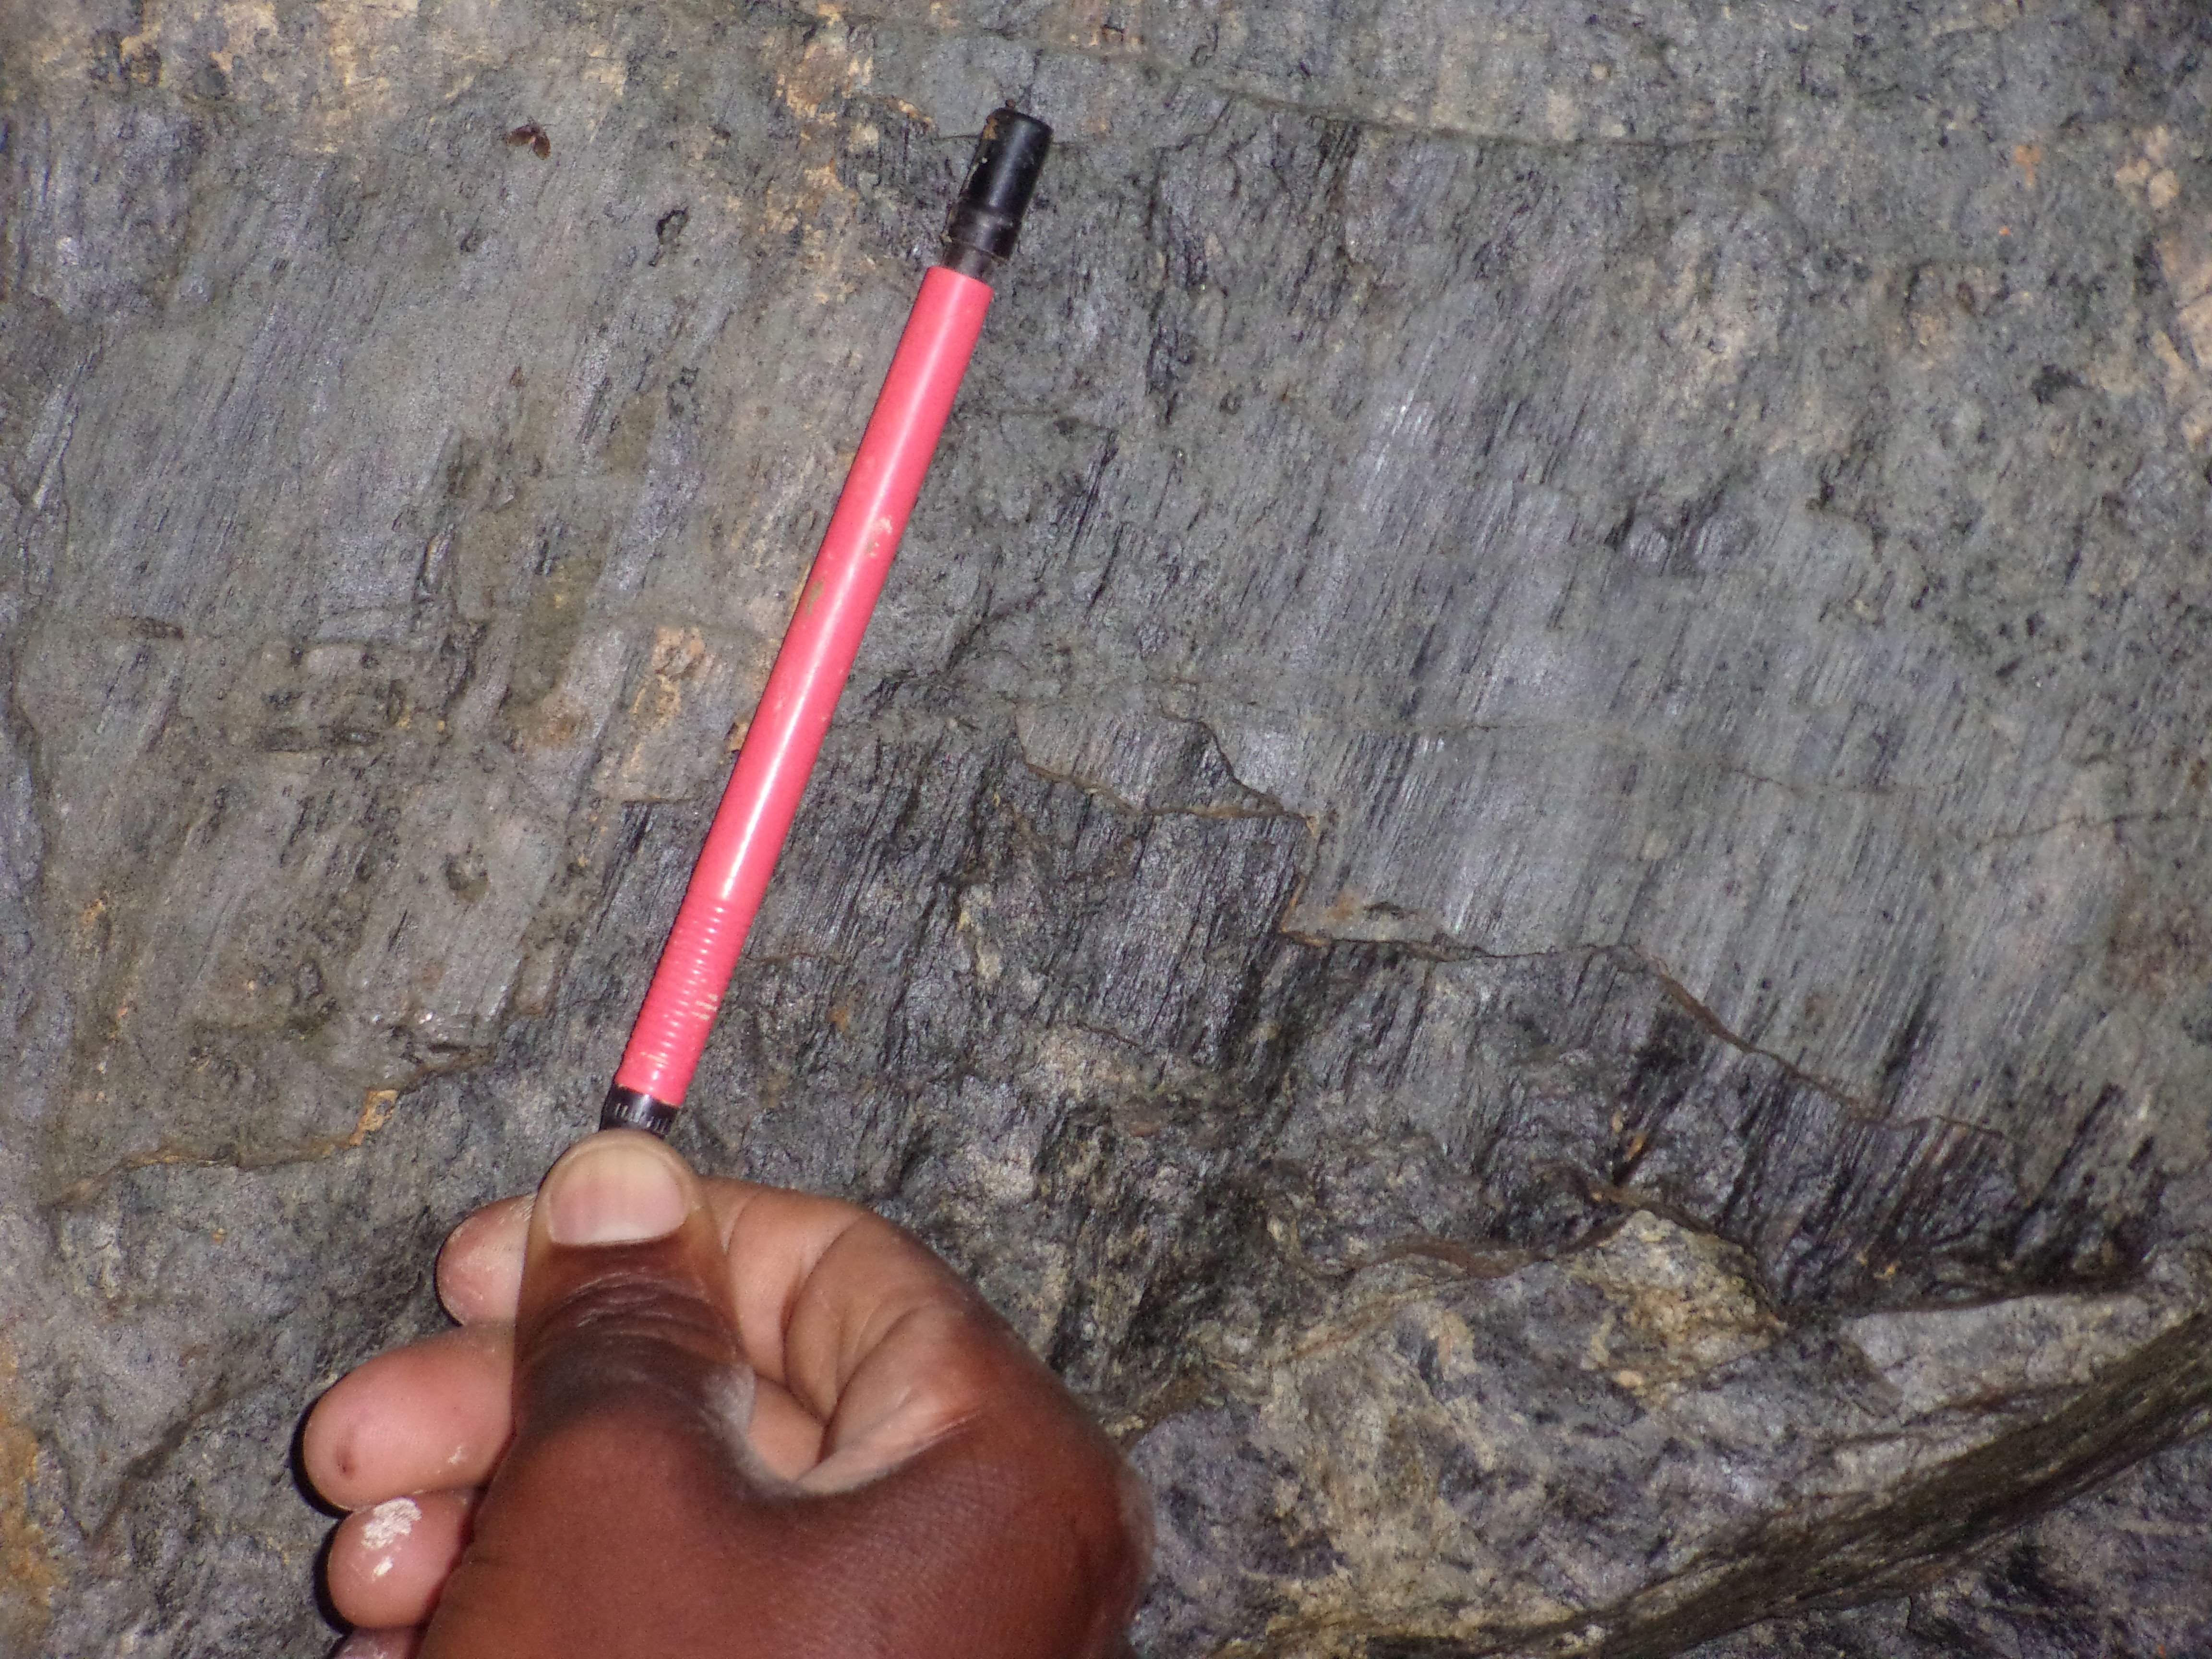
A: Slickenlines (parallel to pencil) developed on a fault surface. The surface containing these lines is called a slickenside – old Cornish miners term. An alternative name for slickenlines is striations, or, if they are deep enough, grooves. These are mechanical scratch marks on the fault surface. Slickensides are common where the fault surface is coated with clay (as in the example shown) or graphite. They indicate the line of movement but not its direction or vector. In this example the fault is dip-slip, but it could be either normal or reverse. Slickenlines are easily formed and easily destroyed (you can usually make a few yourself with the point of your hammer): as such they are generally unreliable indicators of overall fault movement.
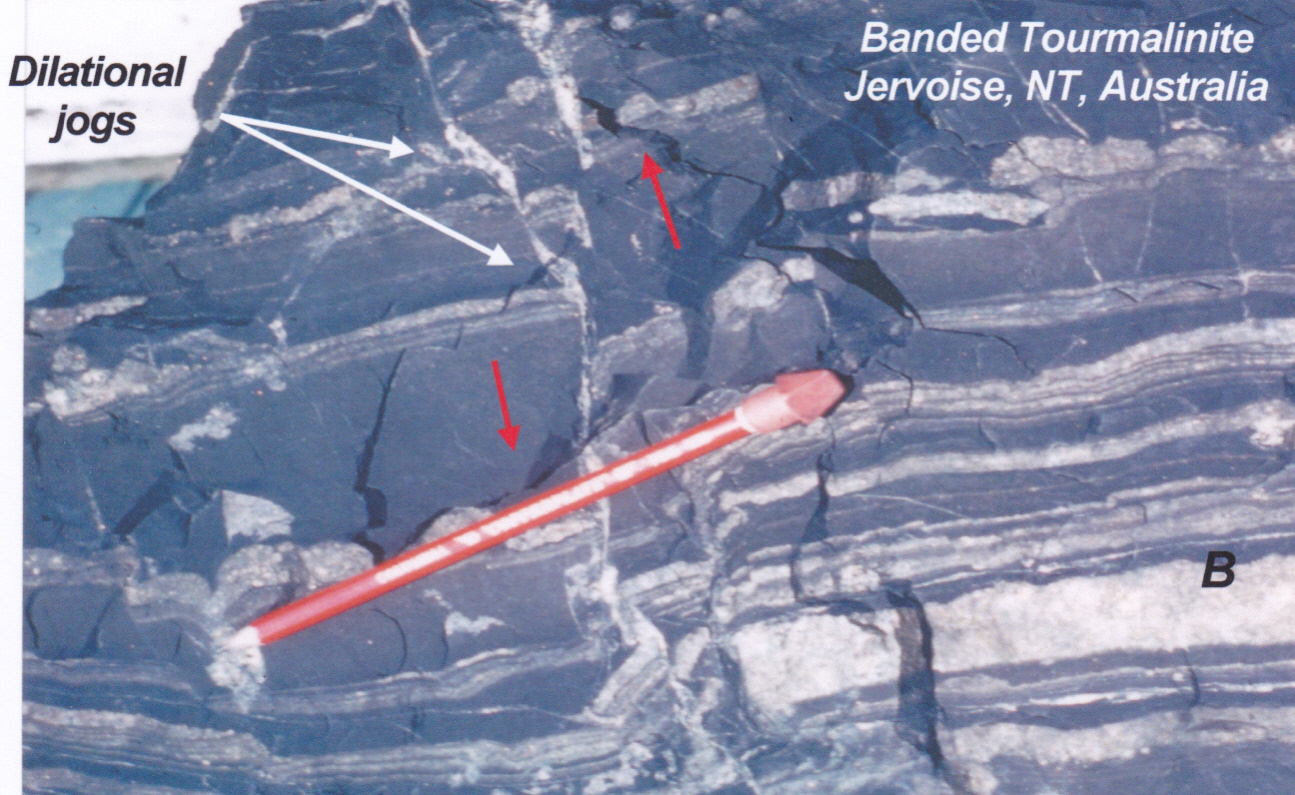
B. The movement across a small fault at a high angle to layering is easily determined by the displacement of marker beds. However, in this case, even without the marker beds, fault displacement could have been determined by the presence of small calcite-filled dilational jogs along the fault. Such jogs are a type of mineral filled T (tension) surface characteristic of brittle deformation. Although this is an insignificant fault, through a fractal relationship, it gives insight into the movement of an adjacent, unexposed, larger fault of the same generation. This unusual rock from Jervoise, Northern Territory, Australia is a bedded tourmalinite – which I interpret as a metamorphosed, boron-rich, exhalative sediment.
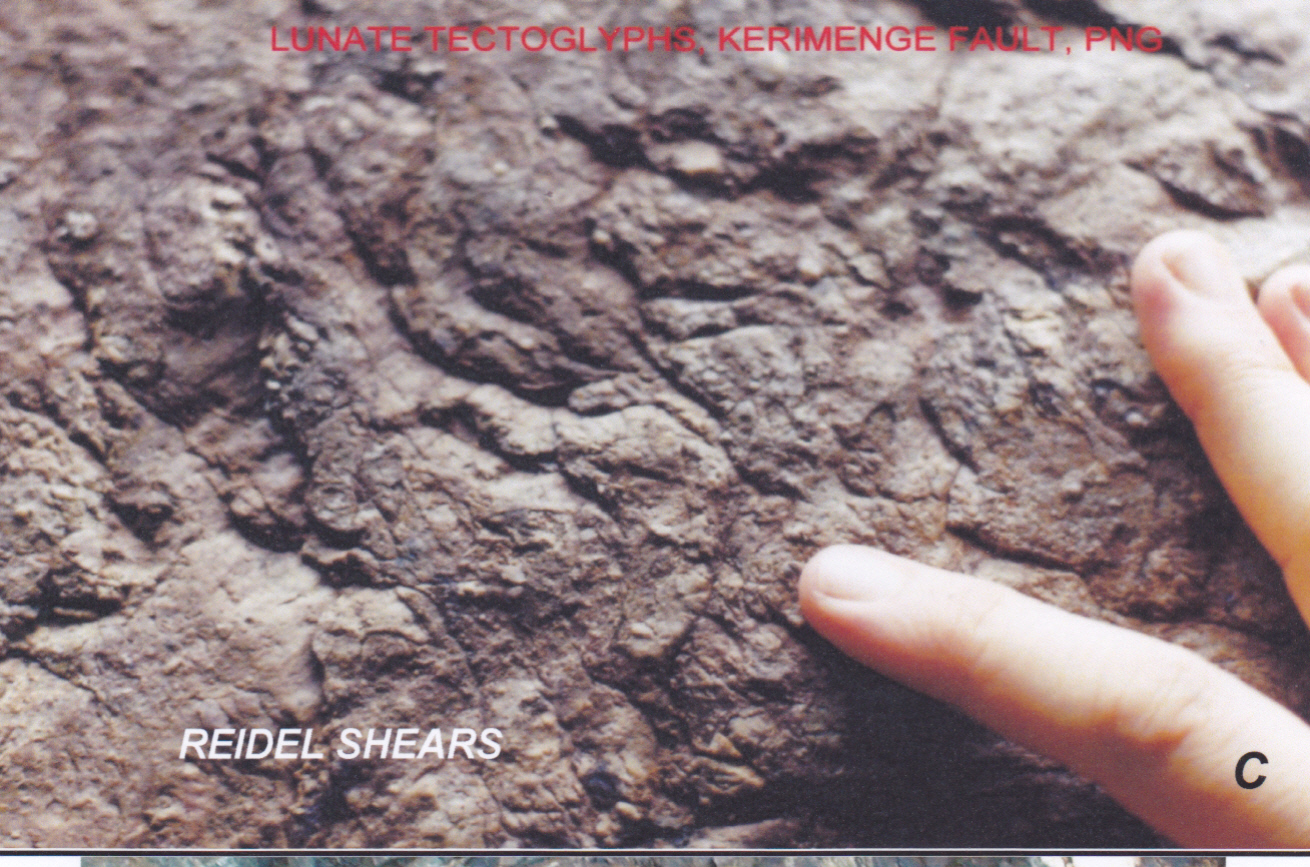
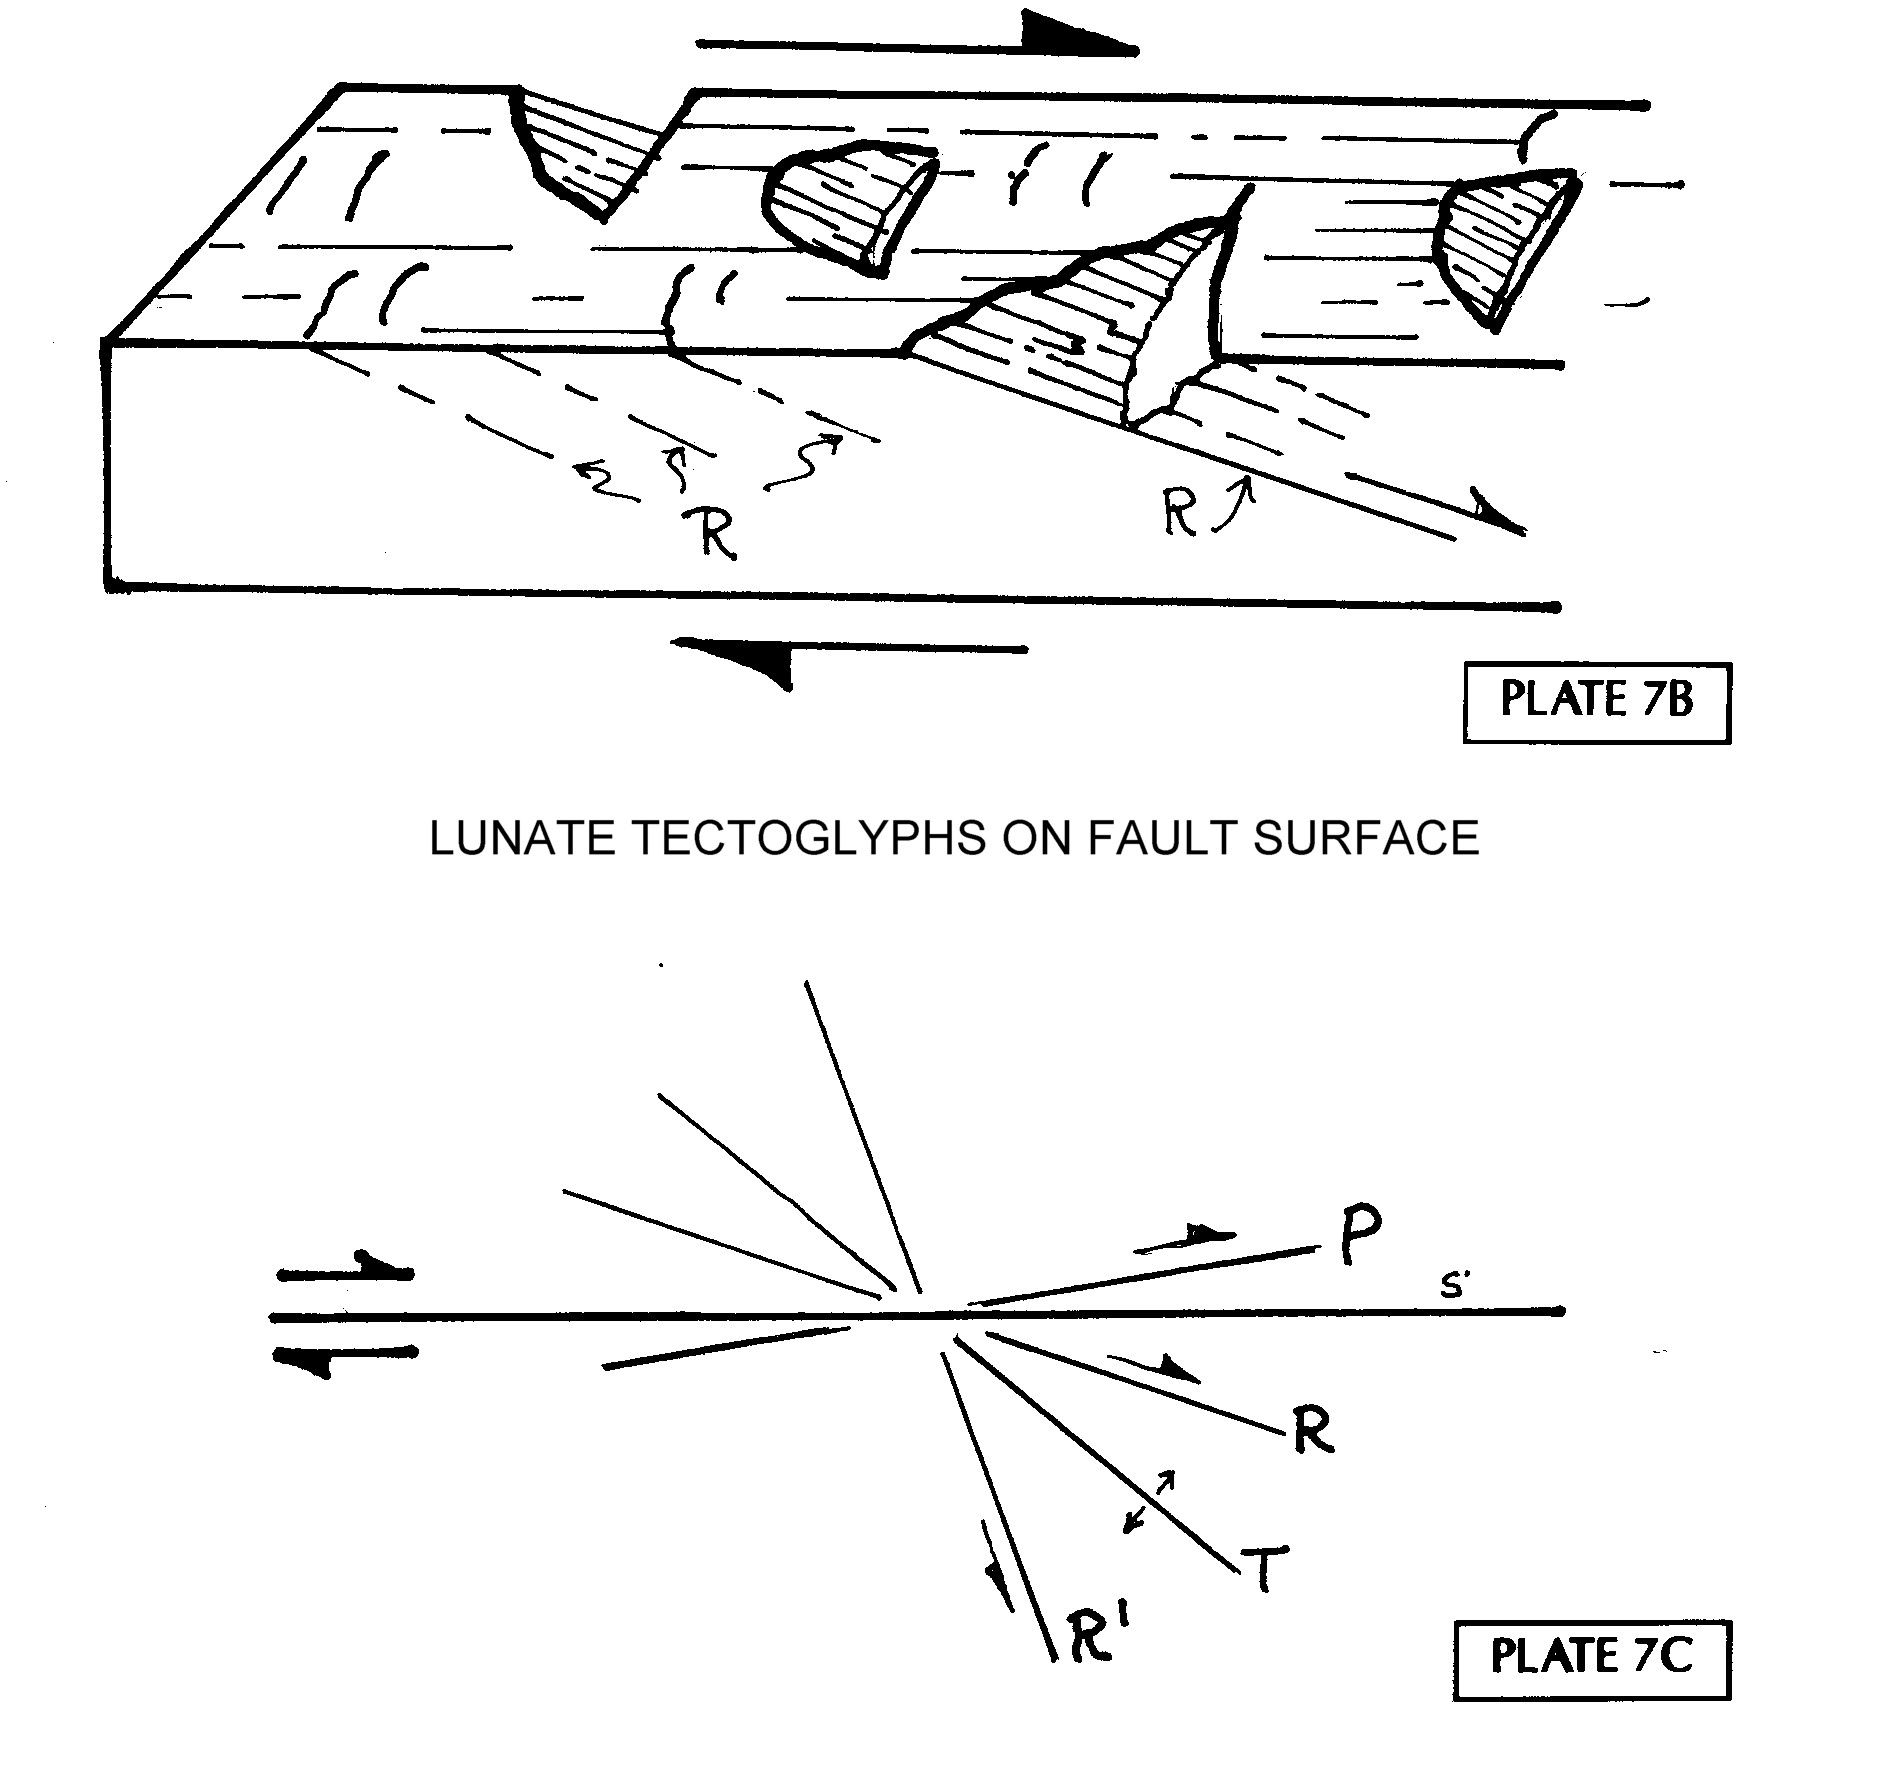
C. View of the exposed face of a fault which cuts a large (pre-fault) quartz vein. On the face, short, lineated, crescentic fractures trend away from the fault surface at an angle of around 20 degrees. The low angle and the presence of lineation on the surfaces indicates that these are not tensional (T) fractures but Reidel Shears (R). The attitude of the shears and the horns of the crescents point to the direction of movement of the missing block (it has moved to the right indicating a sinistral strike-slip movement). Kerimenge Fault, Wau District, Papua Nugini.

D. A zone of sigmoidal quartz-filled tension (T) fractures indicates sinistral strike-slip movement on a fault cutting meta-basalt. Poseidon pit, Higginsville, Western Australia.
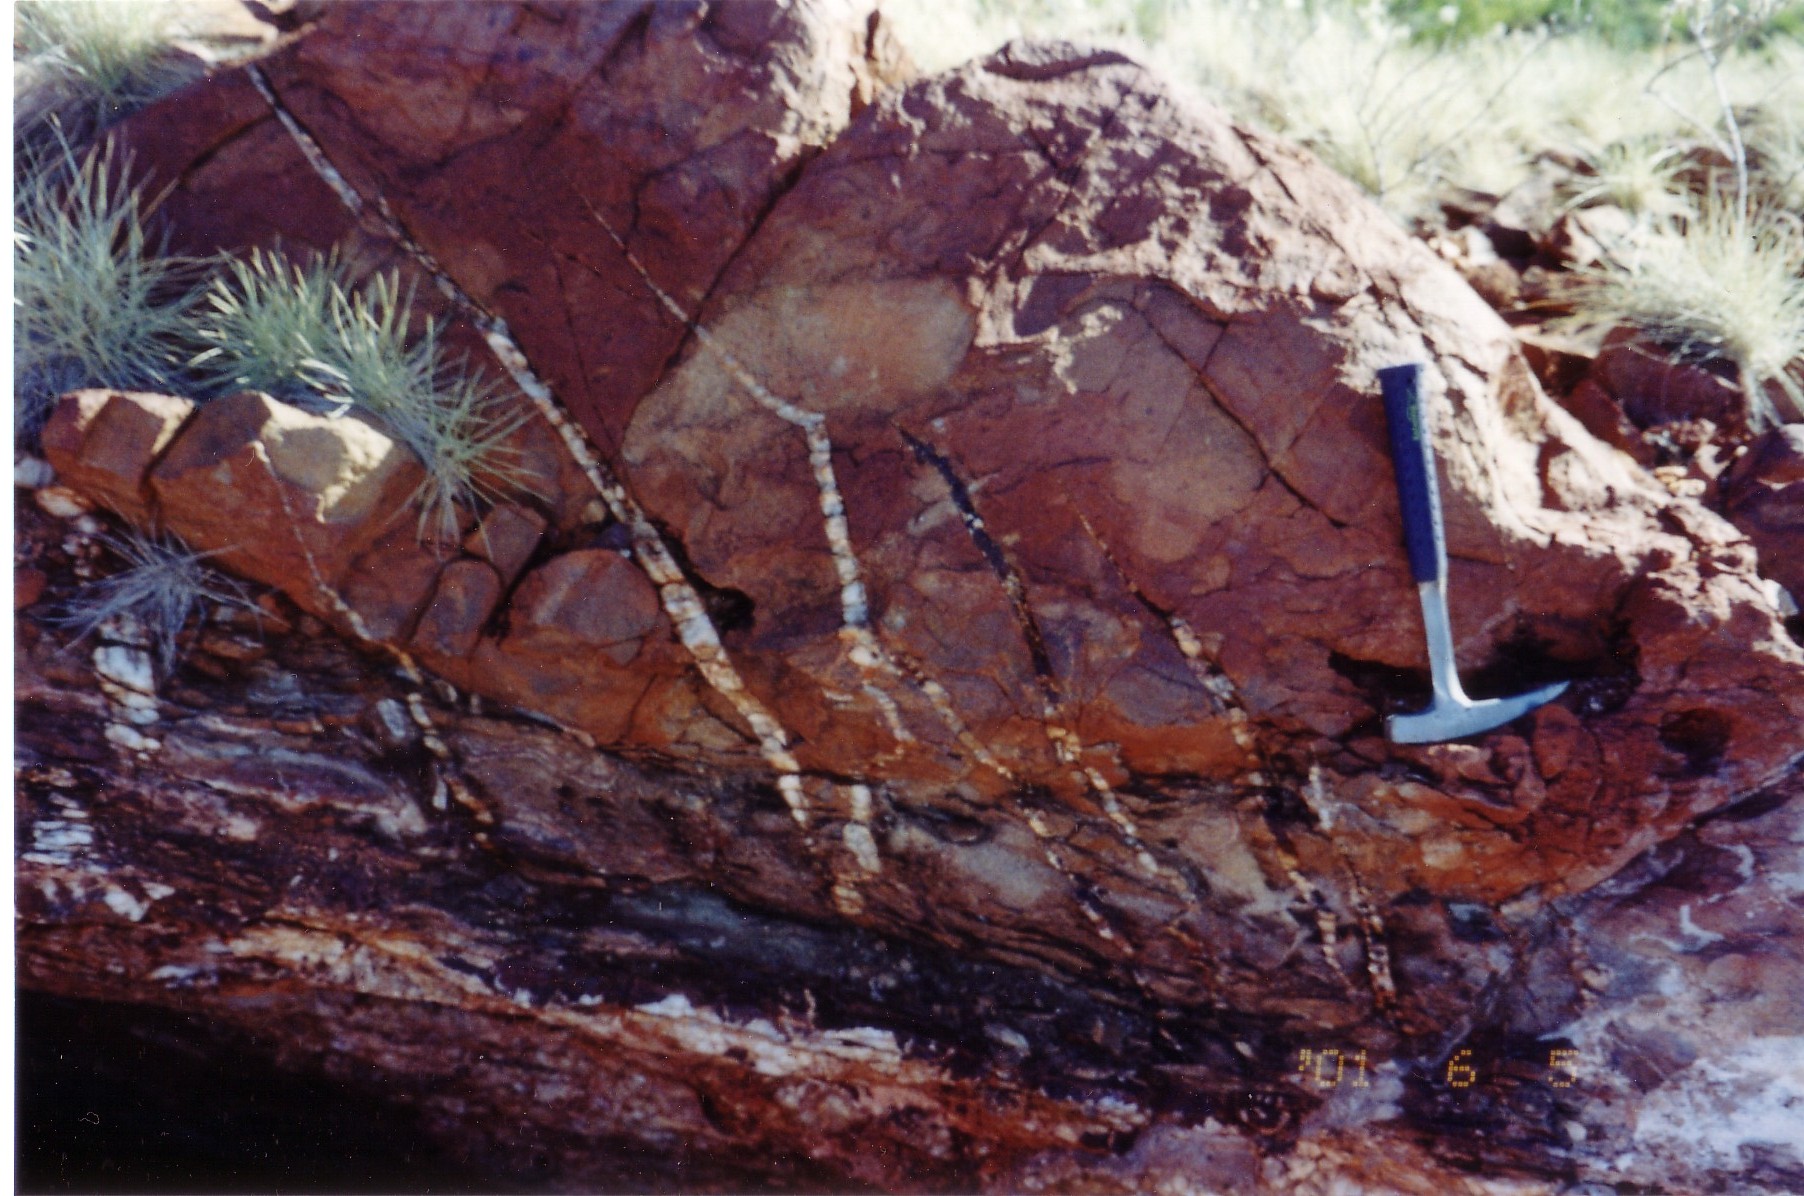
Sigmoidal quartz tension veins in Proterozoic sandstone, Ashburton Province, Western Australia
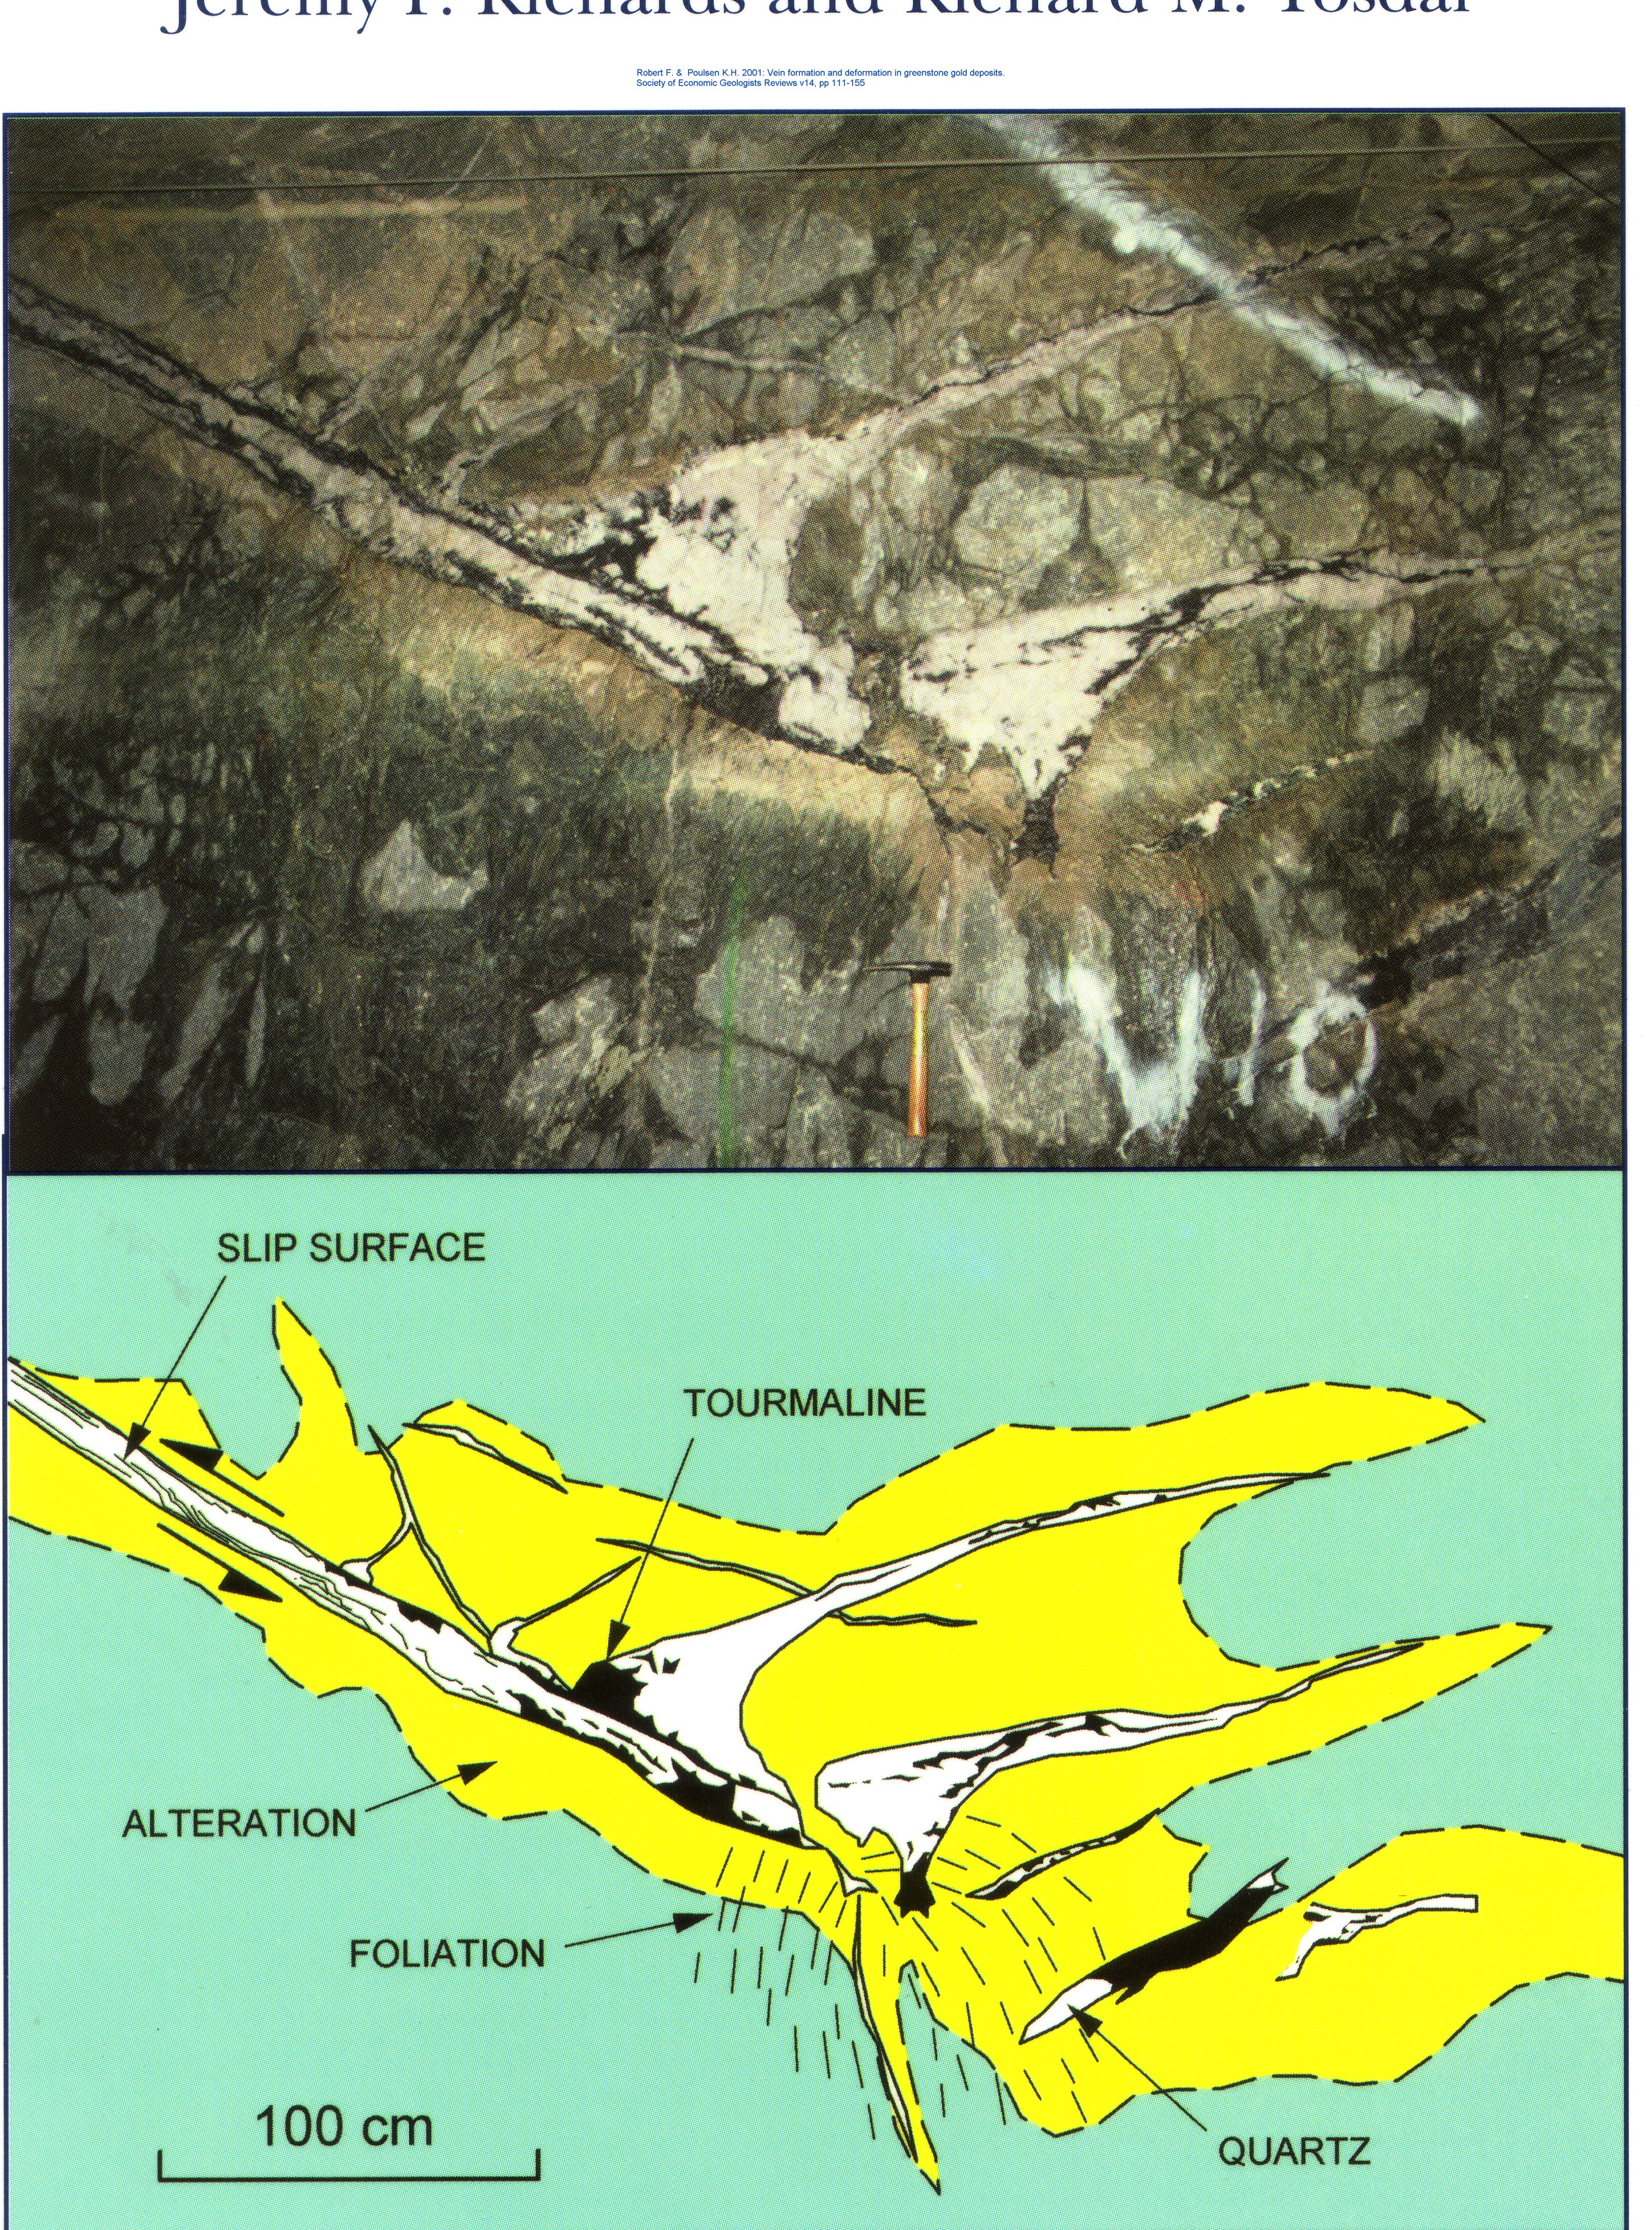
(above) Gold-bearing Tension veins as splays from a small thrust fault exposed on the wall of the Sigma underground Mine, Val D’or, Canada. Note the S surfaces (foliation) at 90 degrees to the tension veins. Illustration taken from Robert F & Poulsen KH 2001: Vein formation and deformation in greenstone gold deposits. Reviews in Economic Geology v14 pp 111-152.
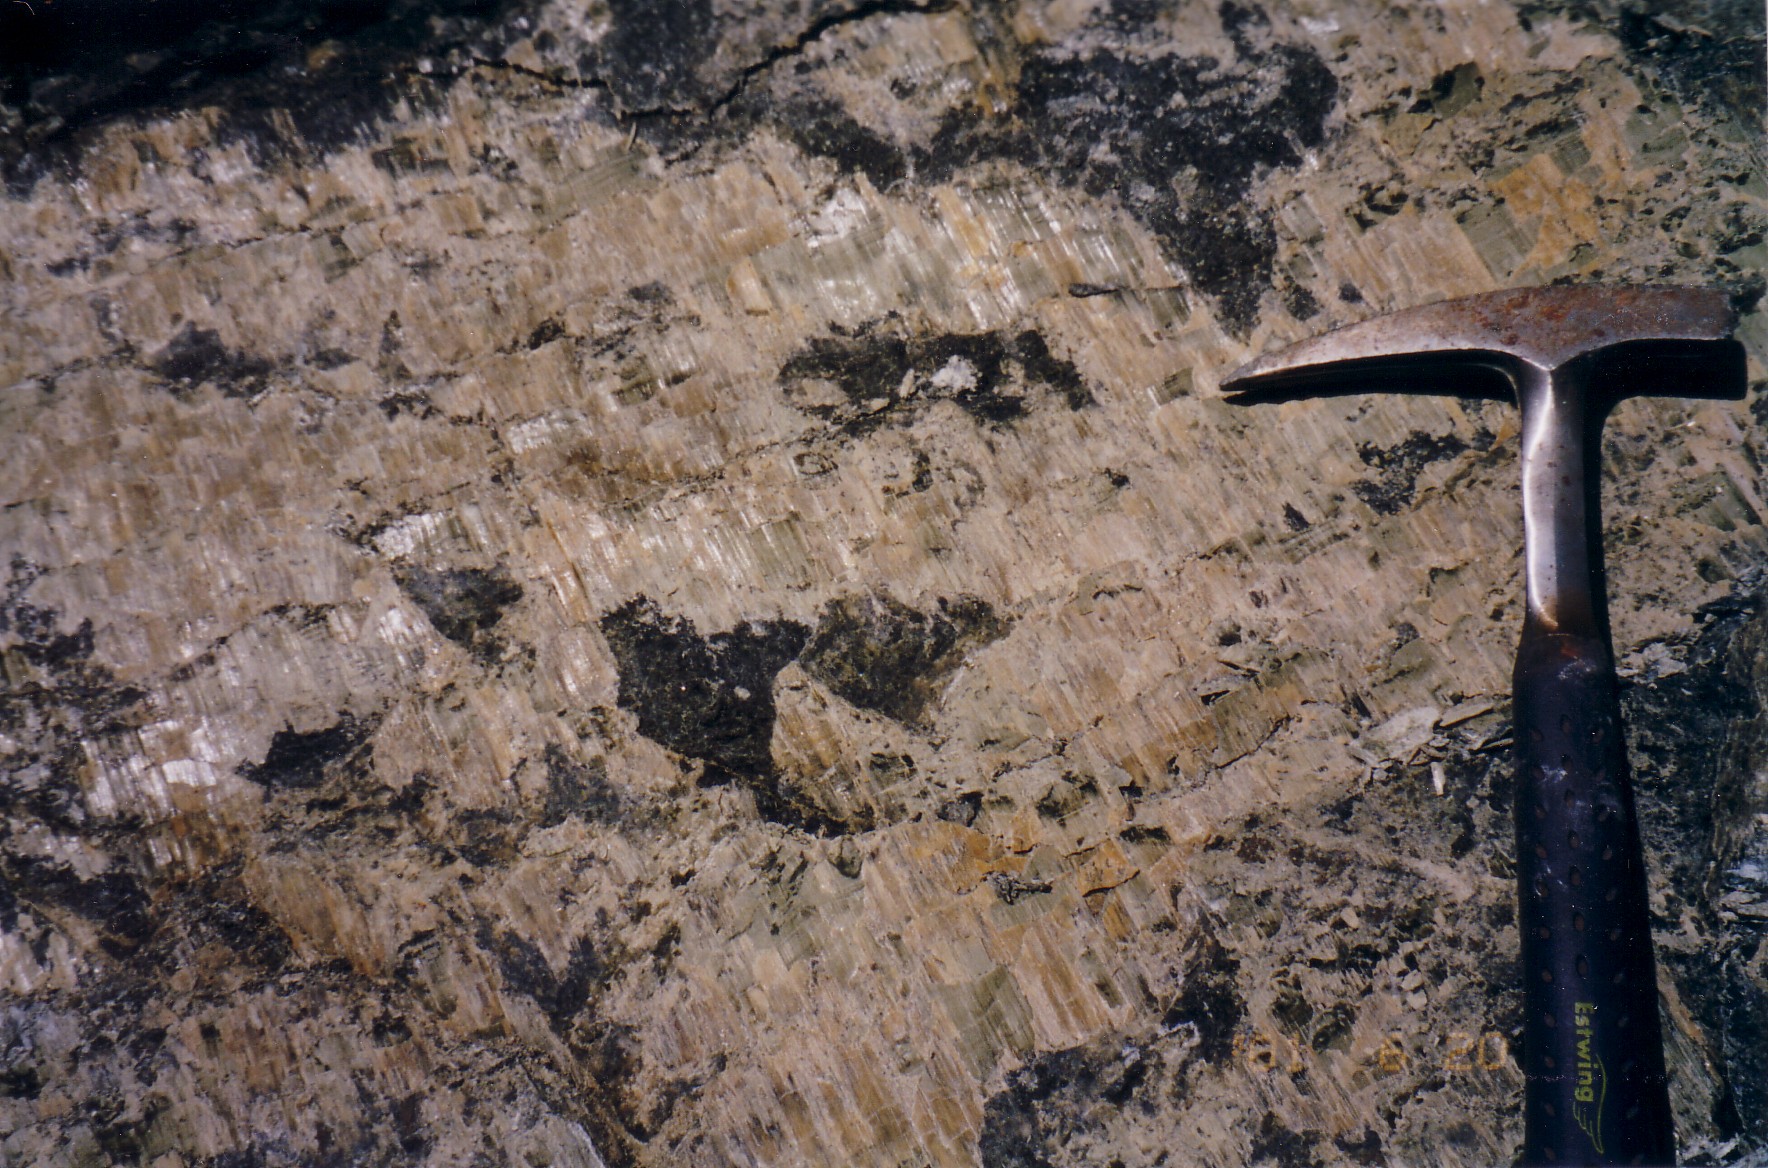
Sheeted quartz fibres with down-dip facing terminations exposed on a vertical fault surface. The missing plate has moved down relative to the exposed face – 70% normal fault dip-slip + 20% dextral strike-slip, movement. Underground gold mine near Kadoma, Zimbabwe. Photo by Mathew Swift.
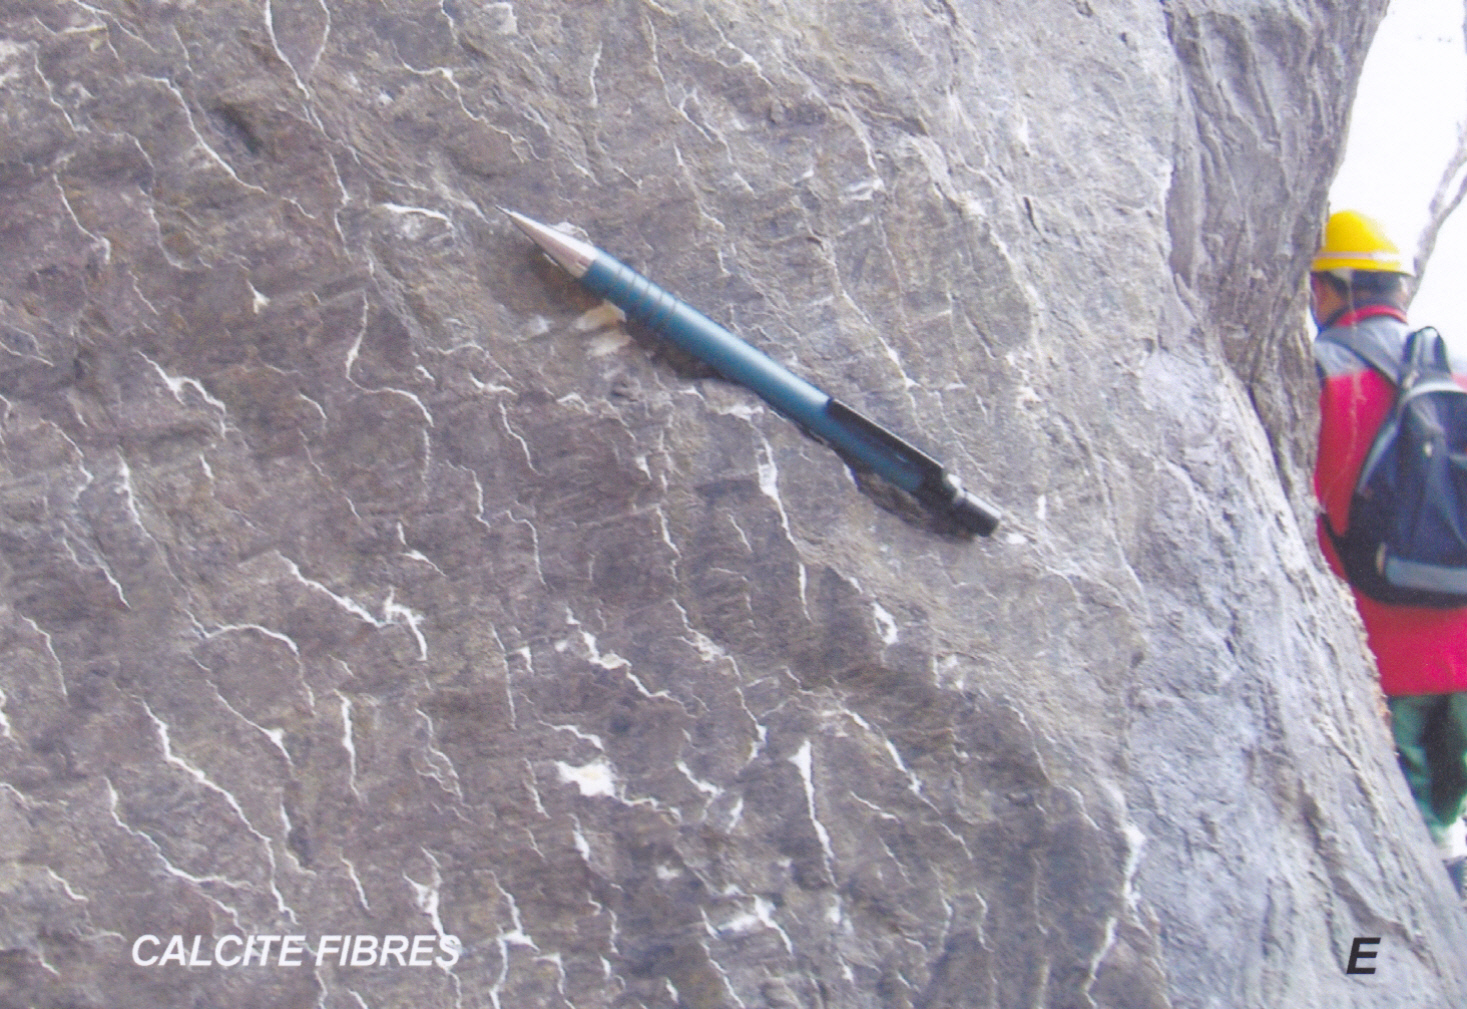
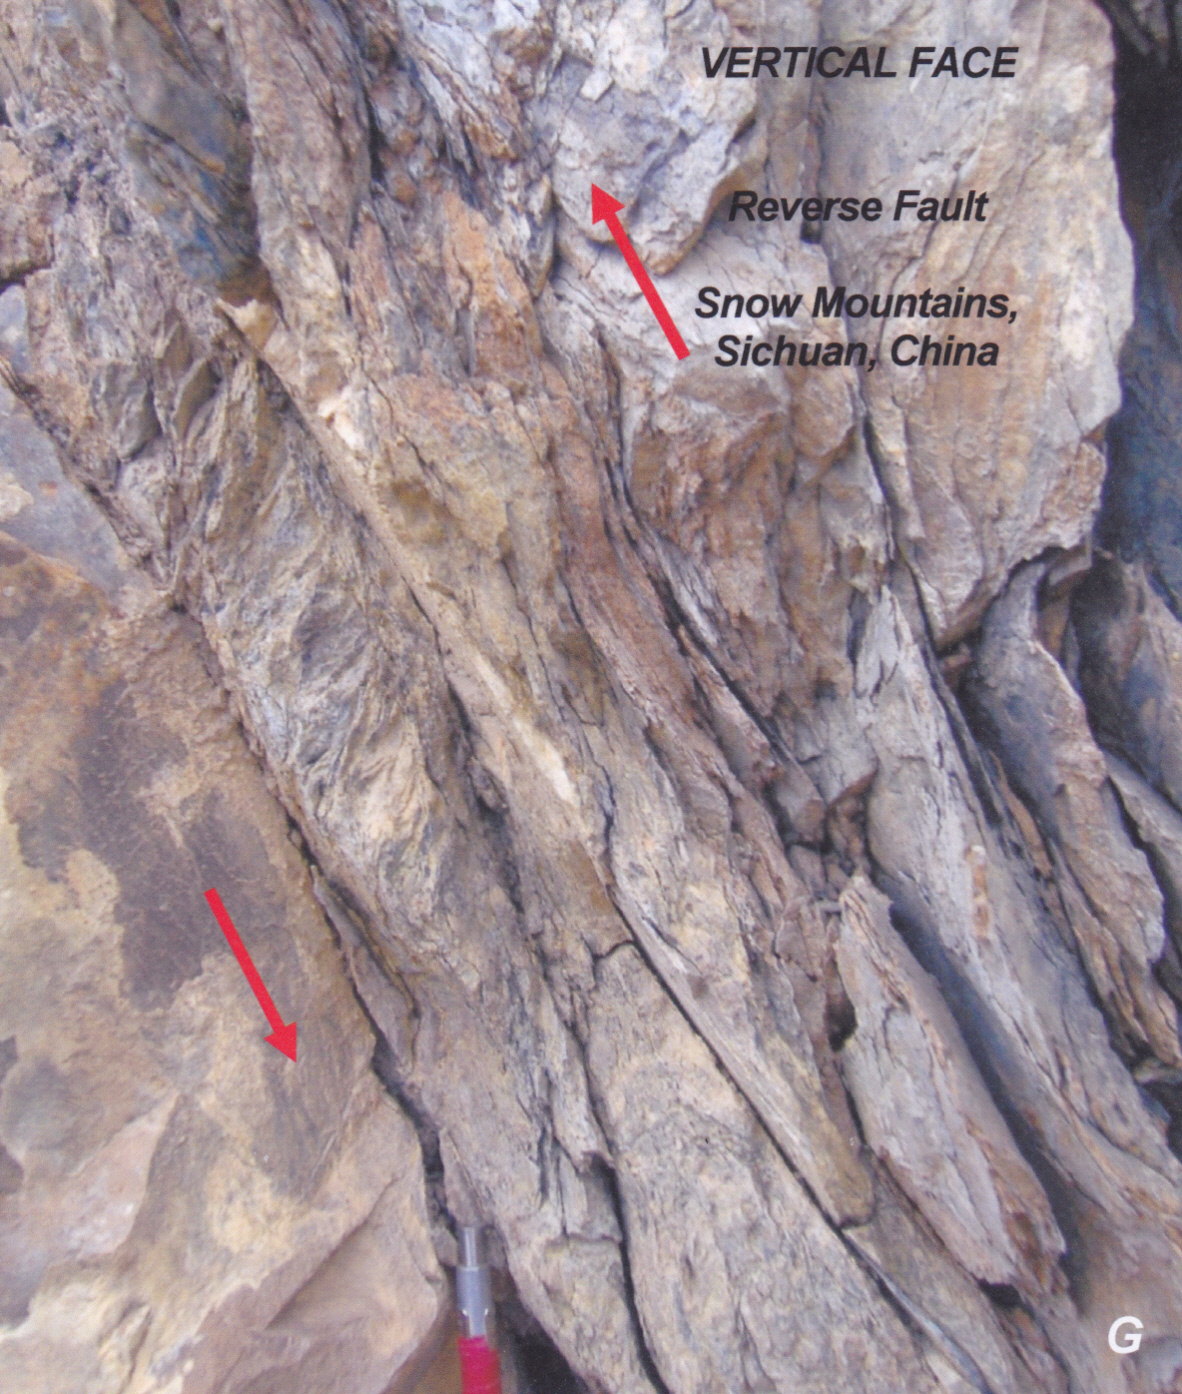
E. Calcite fibres showing strong lineation and a pronounced “shingling” effect coat an exposed vertical fault surface. These structures should not be confused with Slickenlines (see A). The facing of the steps (white crescentic lines) indicates sinistral strike-slip movement on the fault (i.e. the missing plate has moved to the right). Fibres are an example of an overlapping stack of mineral filled dilational jogs – a category of T fracture. Although fibres are a more useful and significant movement indicator than Slickenlines, they are generally typical of joints and faults with small movement along them. Any really significant fault movement will usually grind them off. This example from the Snow Mountains, Sichuan, China.
 Acicular tremolite crystals (fibres) form sheeted overlapping veins on a fault face in peridotite. Missing block has moved down and to the right. RAV8 open cut nickel sulphide mine, Ravensthorpe, Western Australia
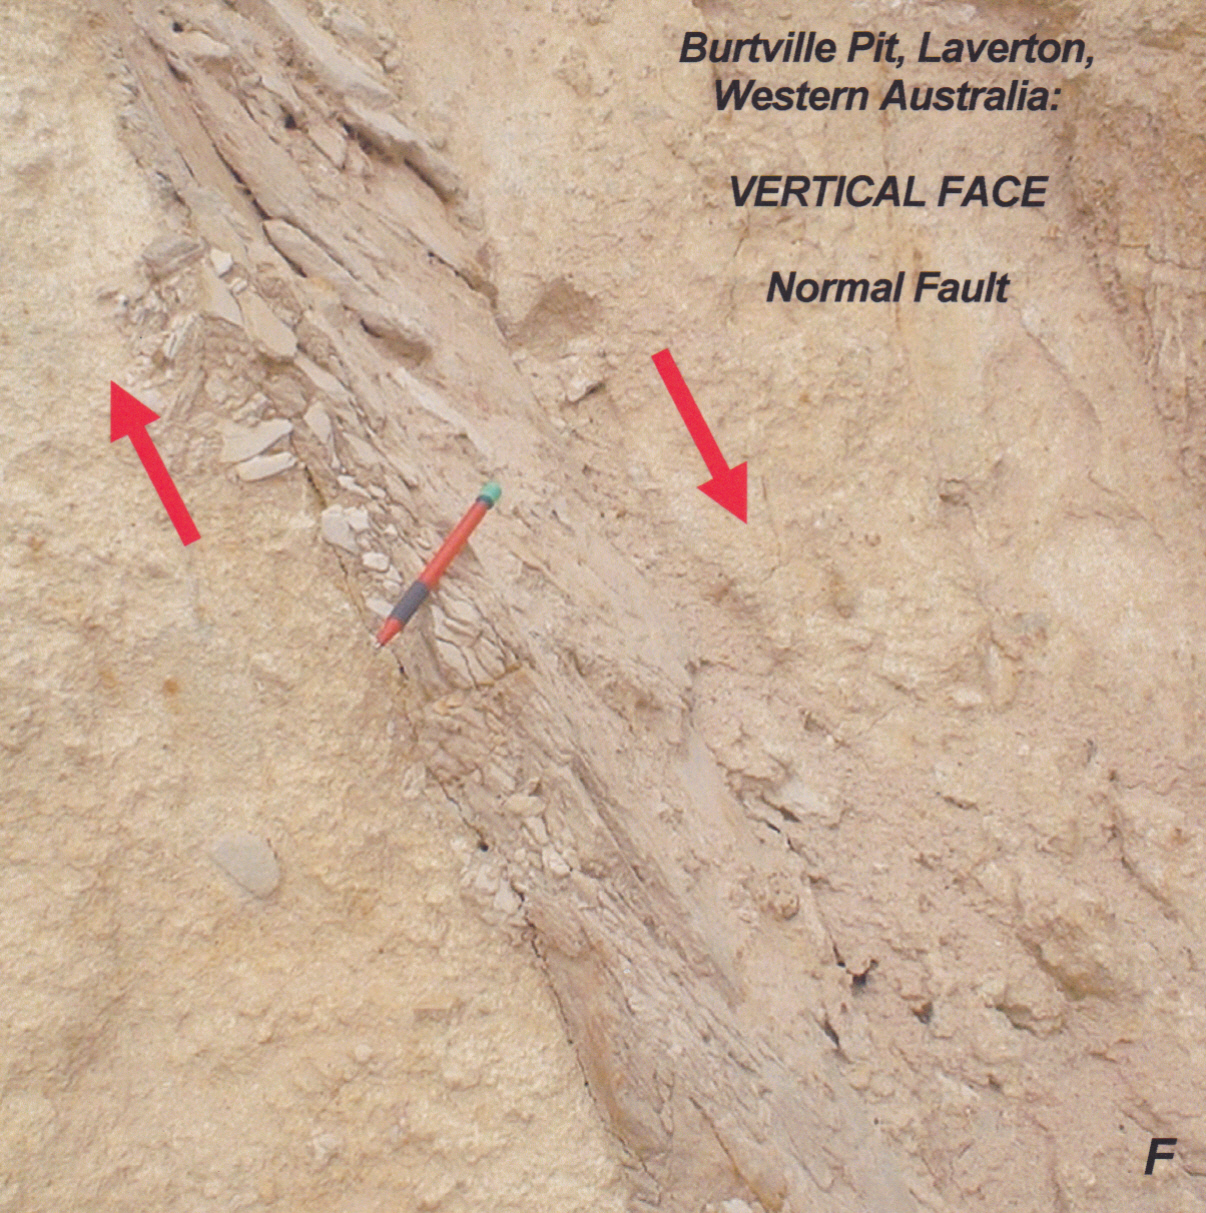
F. A fine penetrative compressive foliation (S surfaces) in a small clay-filled fault zone indicates dominant normal fault movement. Host rocks are weathered granite (saprolite).
G. A fine penetrative foliation at 30degrees to the fault zone (S surfaces) shows rotation into the top and bottom shears of a thrust zone. This is an example of a small thrust duplex. Host rocks are sandstone.
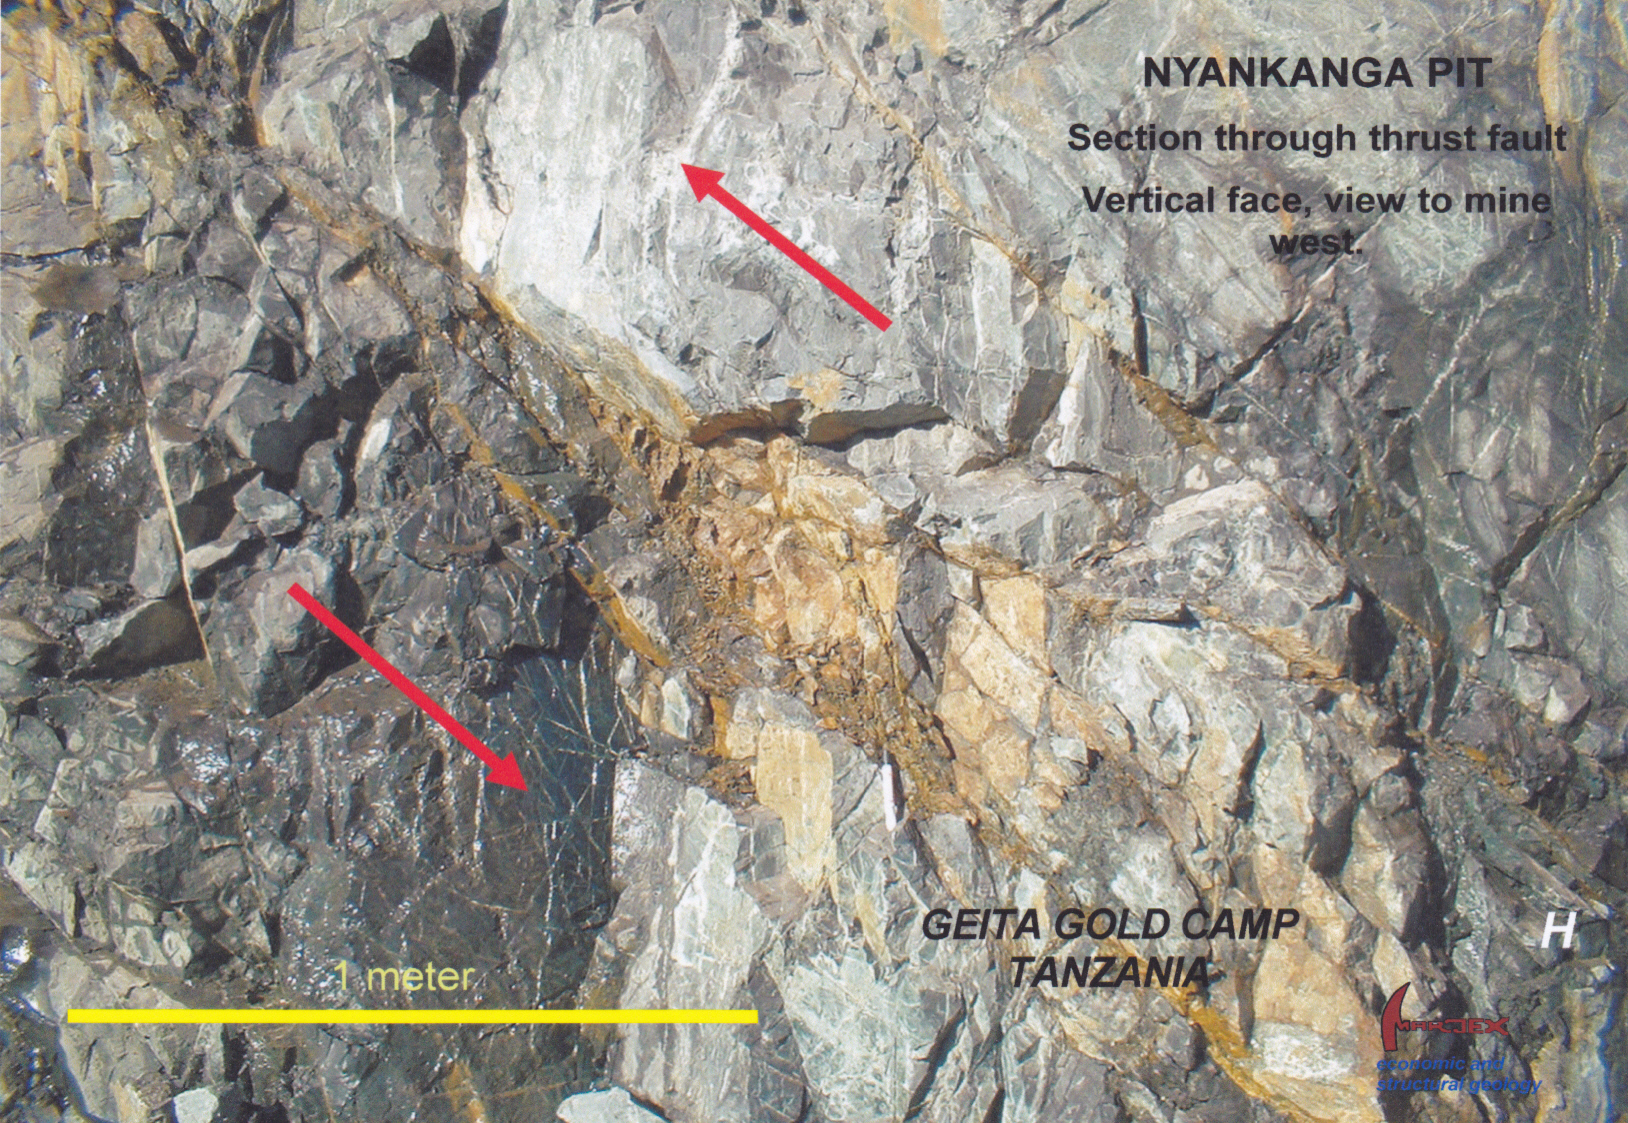
H. A small thrust duplex cutting dolerite. S-surfaces in the fault zone are sigmoidal shaped and clay coated (brown staining). This example from the Nyankanga gold mine, Tanzania. At this mine, the thrusts are post ore and have a significant effect on ore distribution.
Ductile Structures
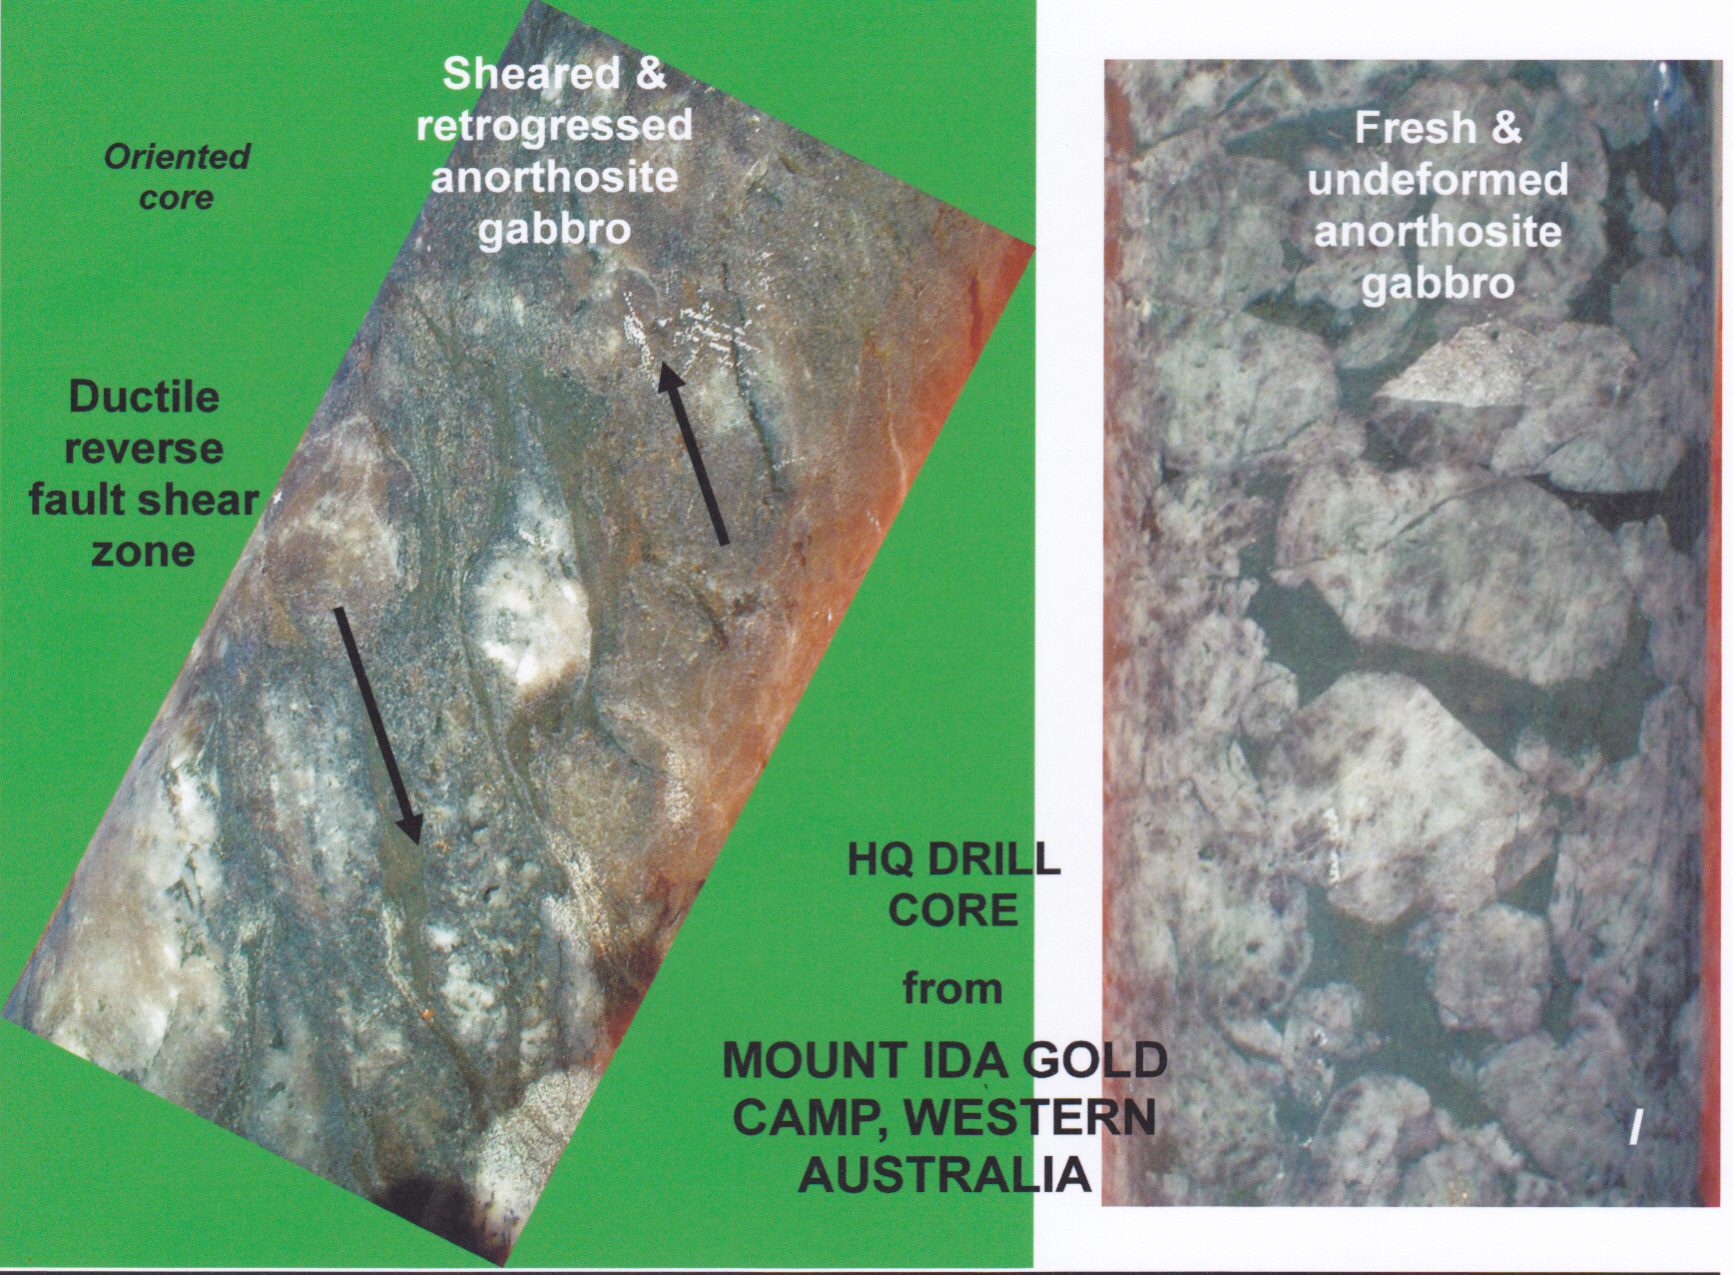
I. A sawn surfaces in HQ drill core (left) shows the effects of ductile reverse faulting on a distinctive big feldspar gabbro. The appearance of the undeformed gabbro can be seen in the core sample at right. A sense of movement can be determined from the asymmetric chlorite “tails” on the margins of relict anorthosite feldspar crystals. In the Mt Ida gold camp, reverse faults such as this are the controls on high grade ore shoots. Note: sense-of-movement indications can only be obtained from oriented drill core.
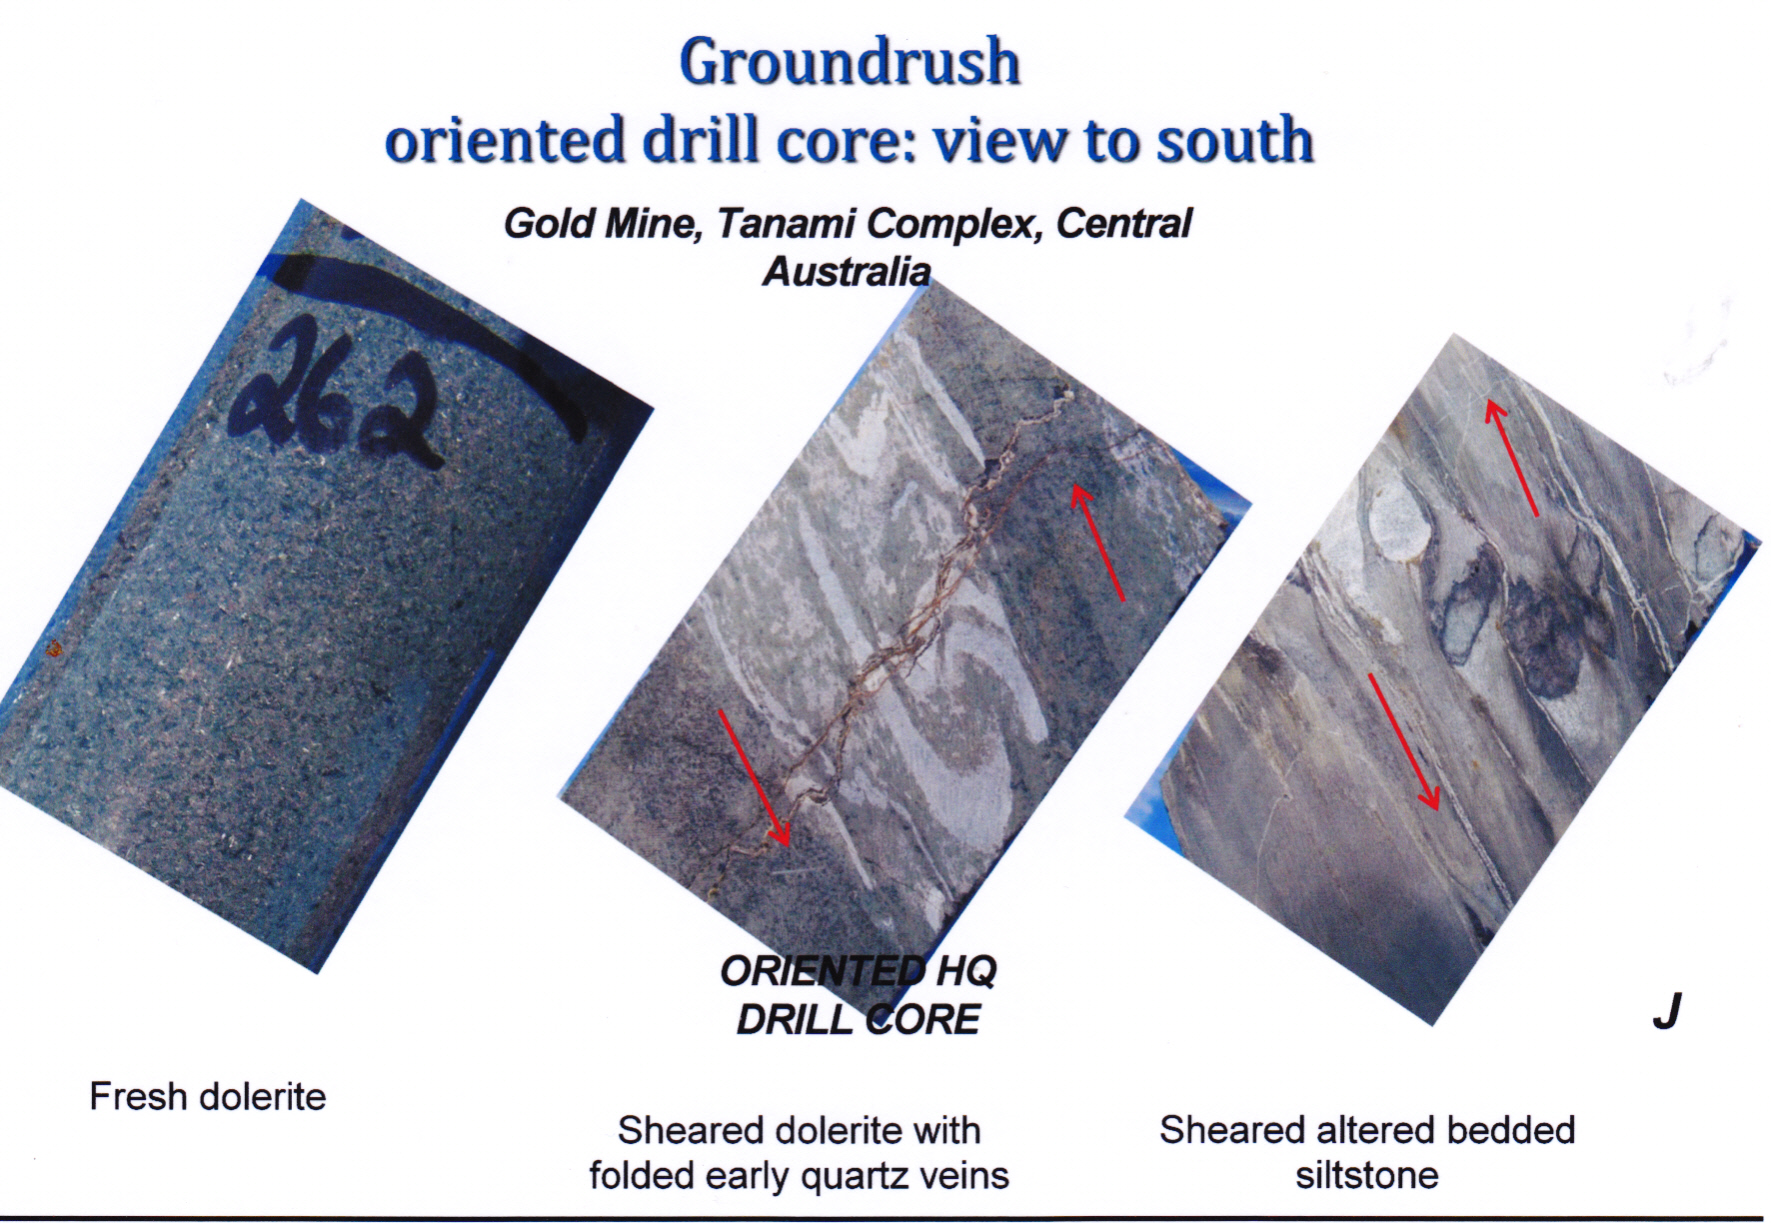
J. More sense-of-movement indicators from oriented drill core. Note asymmetric “tails” on the sedimentary clasts at right. Reverse faulting at this gold deposit controls distribution and orientation of high grade ore shoots.

K. Large orthoclase phenocrysts (that grew during deformation by potassic metasomatism) have grown within, and then been flattened, in a quartz-feldspar-biotite mylonite zone. A dominant pure flattening strain (pure shear) across the rock is indicated, although one phenocryst has slightly asymmetric “tails” suggesting a component of dextral strike-slip movement (can you spot it?). The Redbank Zone is a major E-W trending ductile shear zone with a long and complex history. It is at least 20 km wide and can be traced for over 600 km across Central Australia..
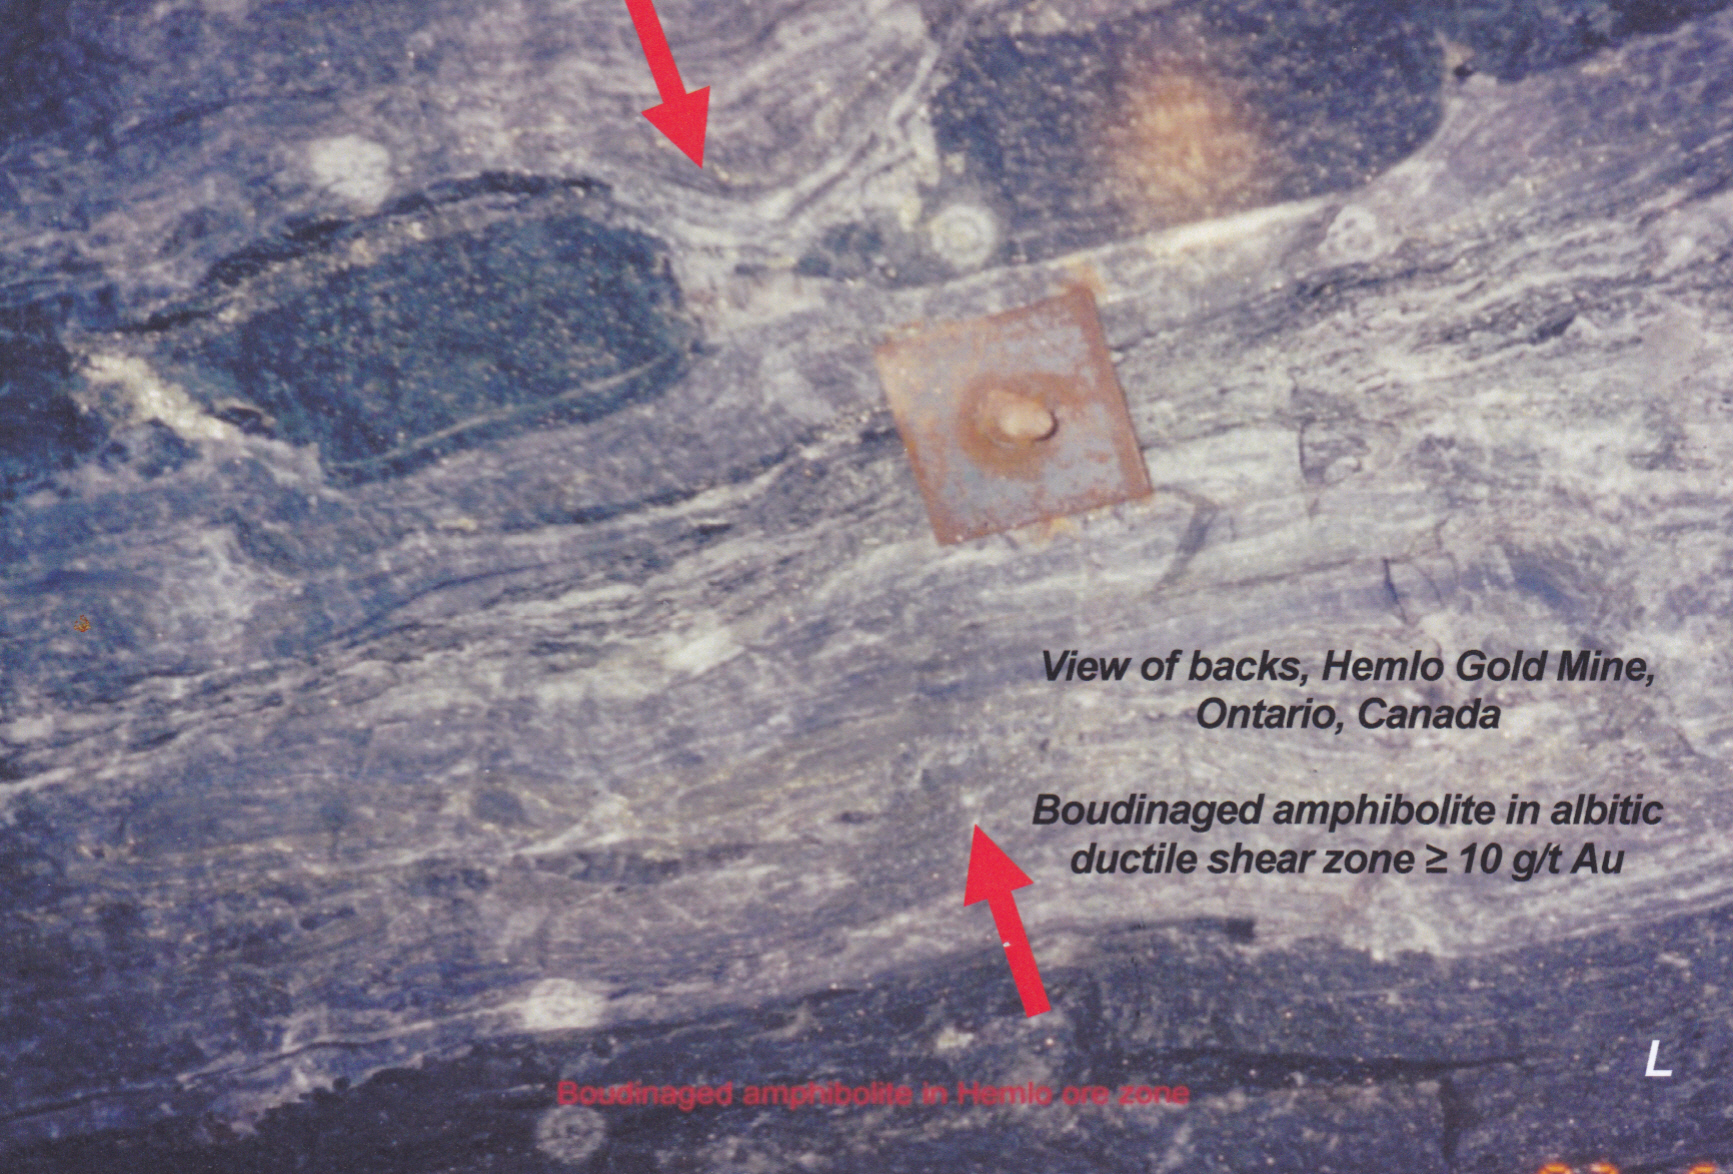
L. A view of the backs (roof) of the Hemlo underground gold mine (the rock-bolt gives scale). The strong foliation of a major shear zone contains an amphibolite band which has broken and been pulled apart in a brittle fashion (boudinage). White quartz and albite has grown in the strain shadows between the amphibolite fragments. As with the previous example, a dominant pure flattening strain is indicated.
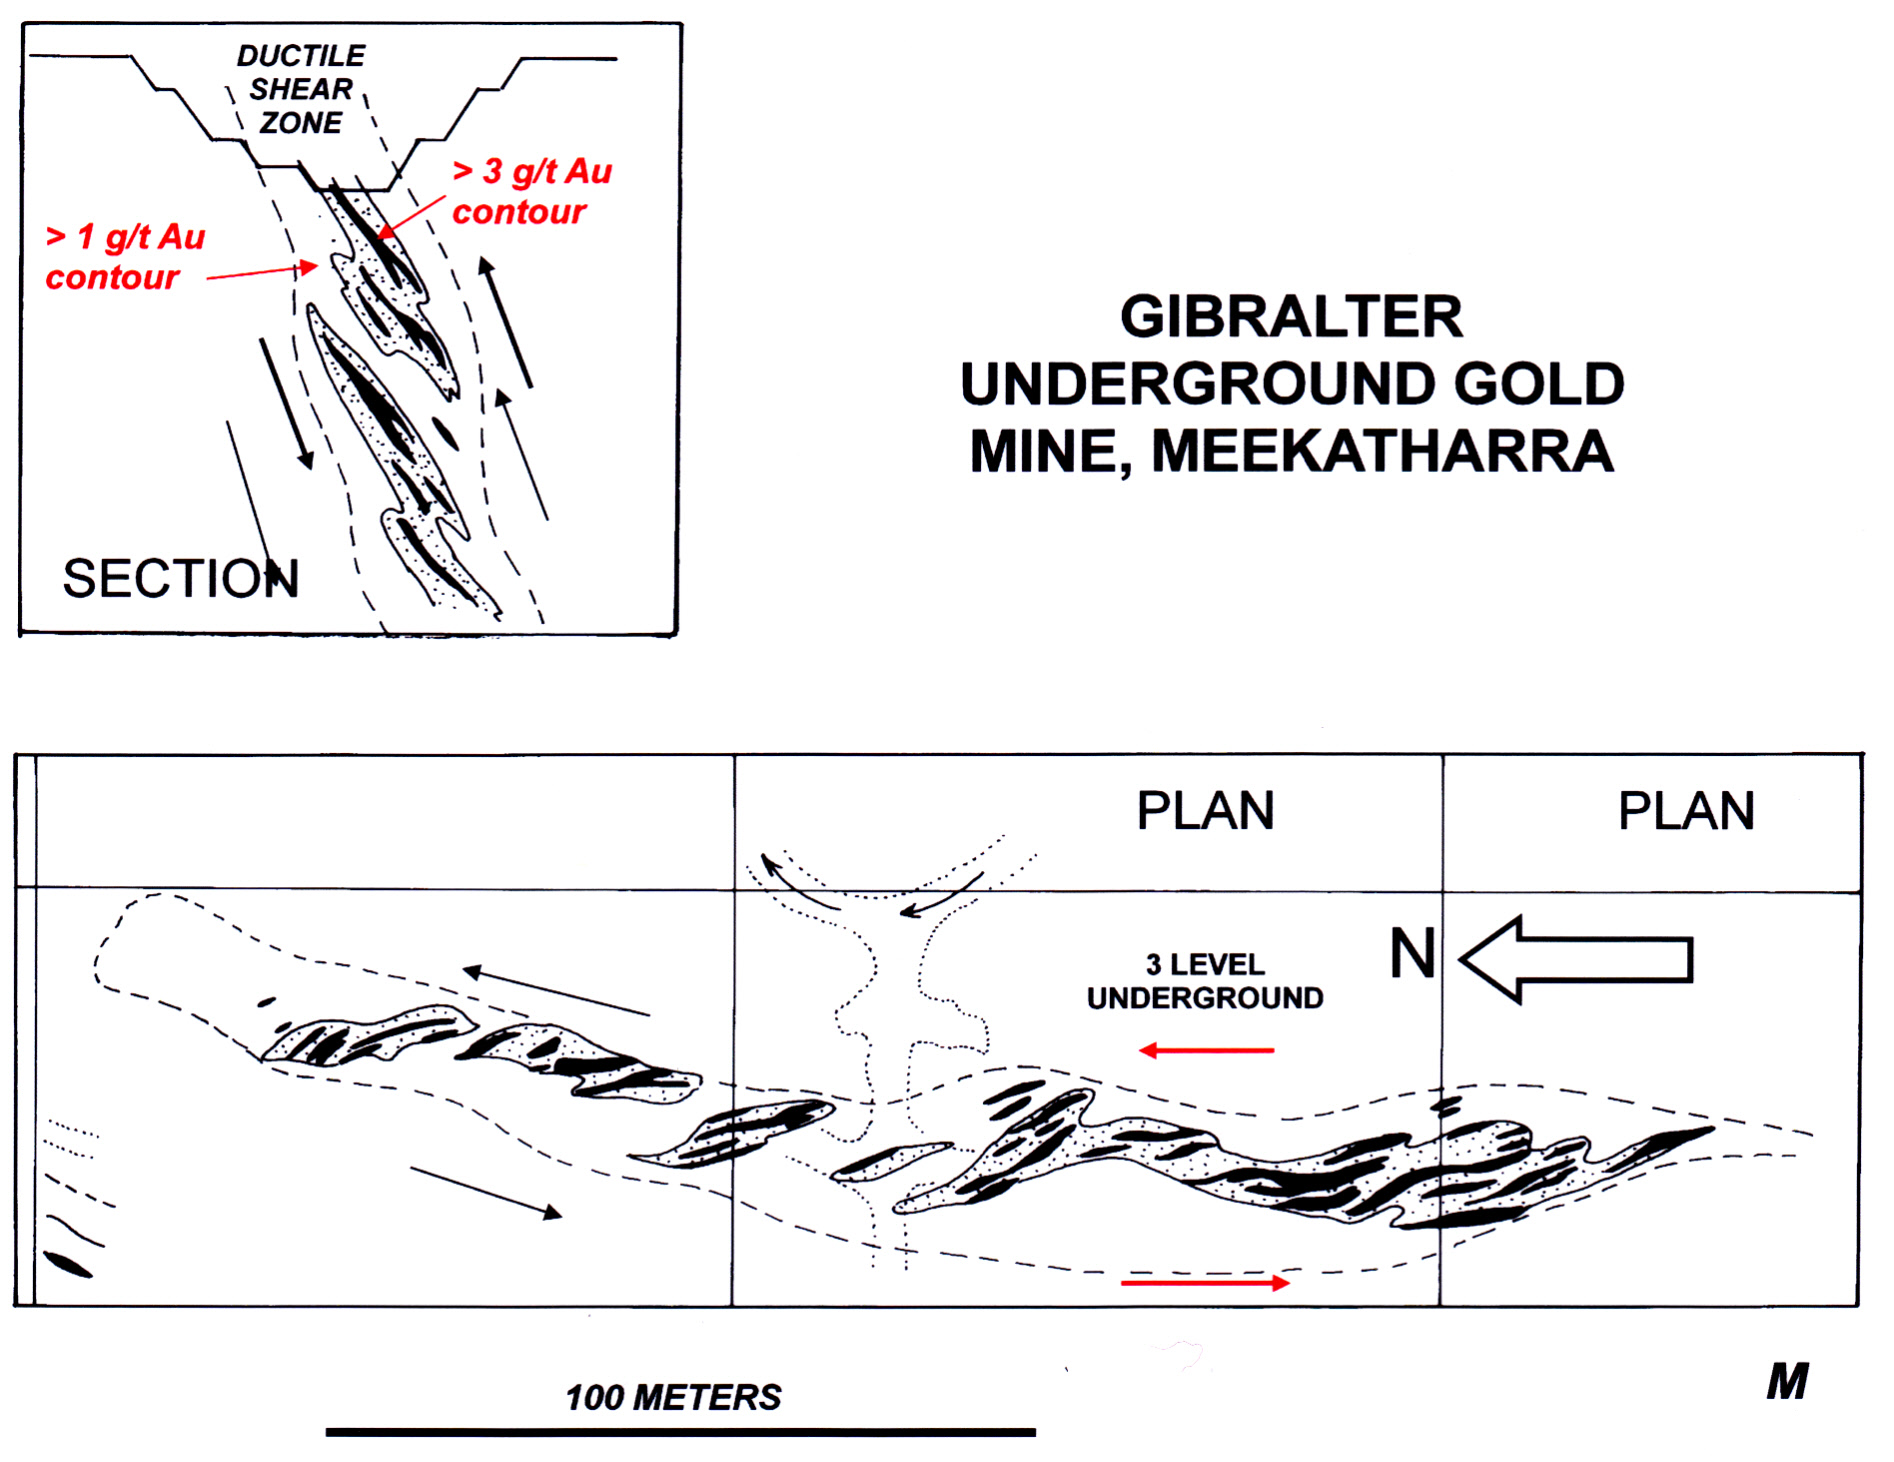
M. A Section and Level Plan from an underground gold mine. The mine lies within a regional ductile shear zone. The zone contains lenses of undeformed felsic porphyry – probably part of a once continuous sill intruded during deformation. Quartz vein stockworks in the porphyry contain high-grade gold values. Individual veins occupy T (tension) fractures and their orientation indicates that shear movement on the zone was oblique-slip, with a resolved sinistral strike-slip component on plan view, and reverse fault component on cross section. Individual veins are too small to map, but their distribution and shape is reflected in the contoured gold values. Meekatharra is in the Achaean age Yilgarn Craton of Western Australia.
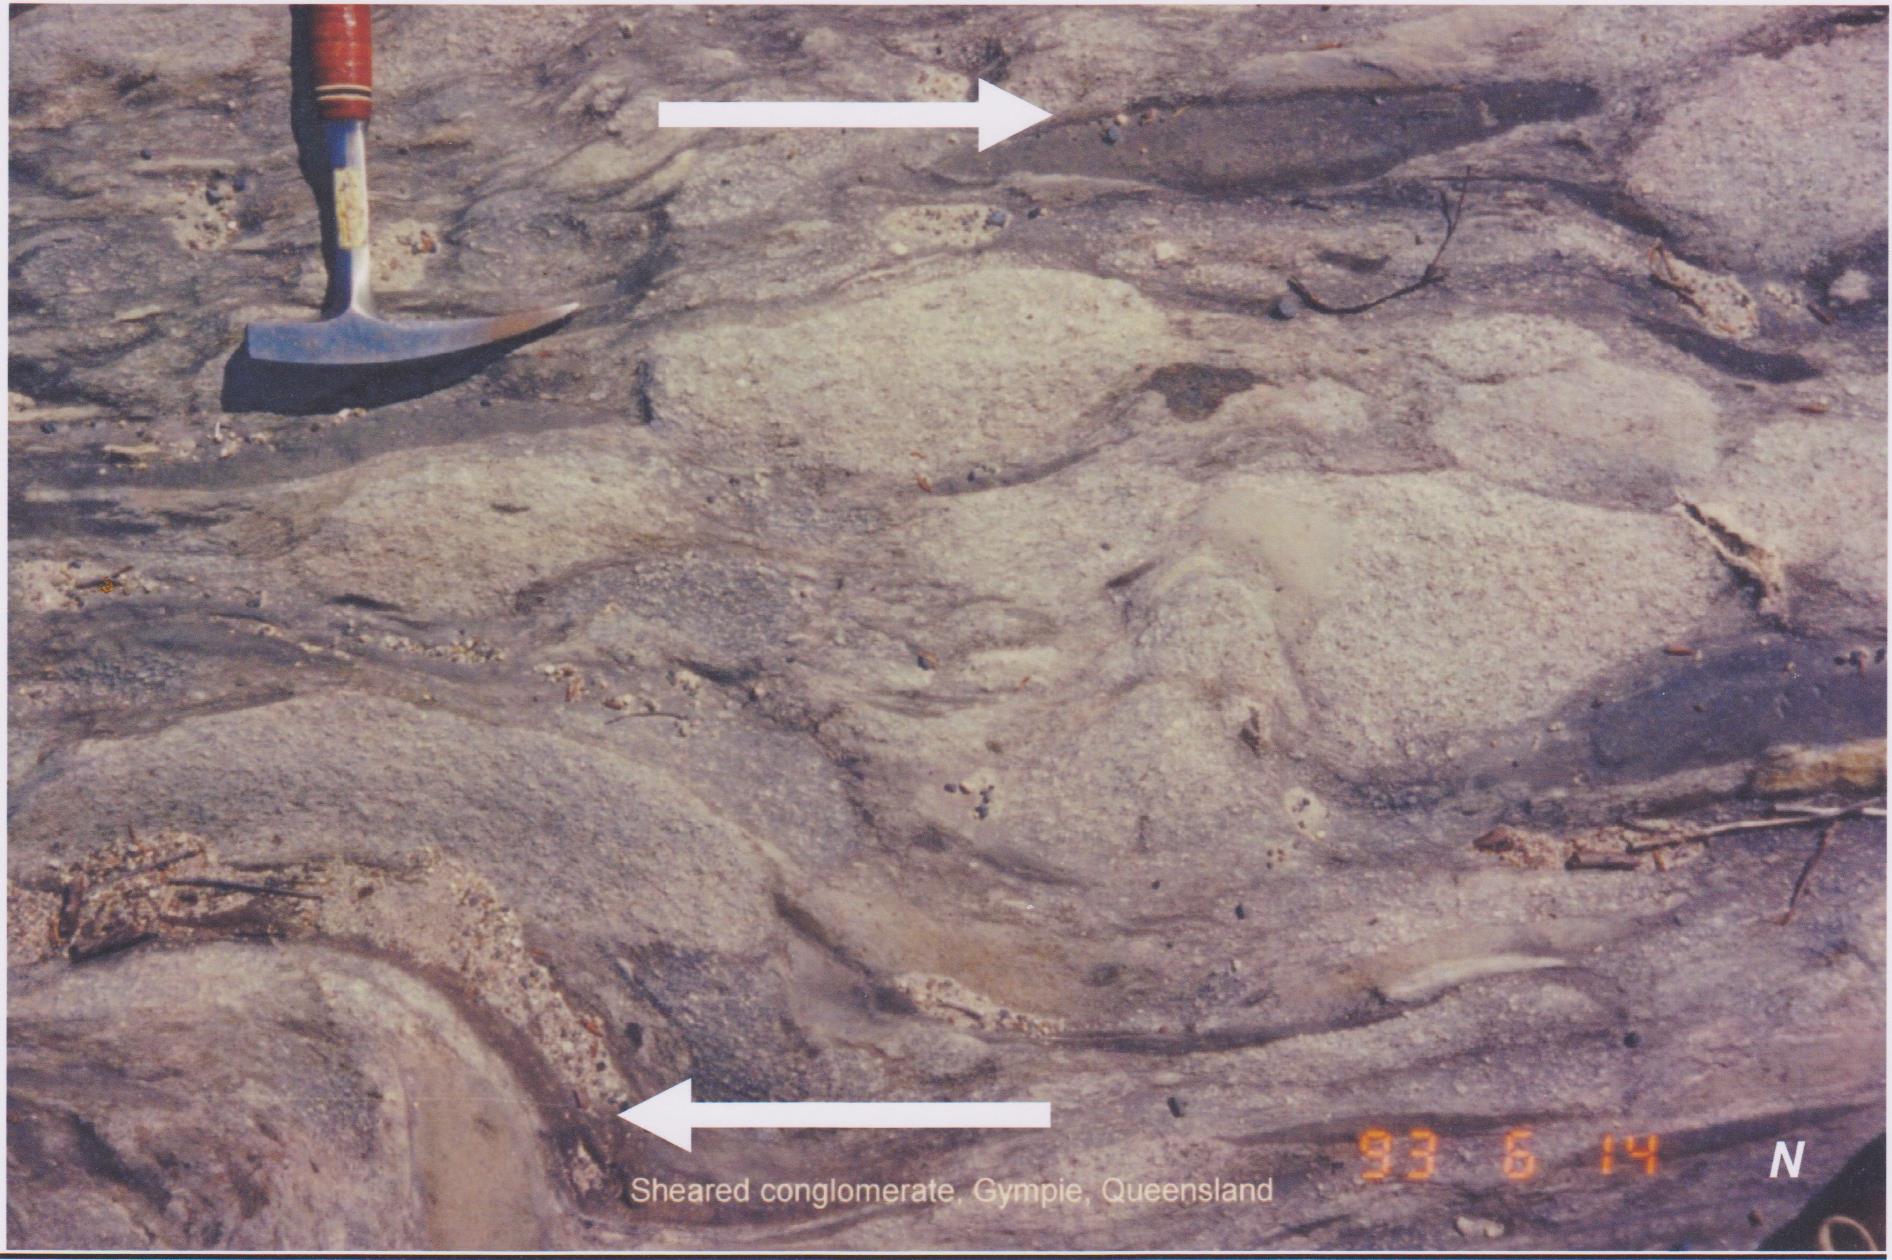
N. A ductile shear zone affecting an Ordovician age basaltic agglomerate at Gympie, Queensland Australia. Asymmetric “tails” on the clasts and a small asymmetric fold pair indicate a dextral strike-slip movement on the fault.
 Quartzite cobbles in sheared Ordovician conglomerate. Note asymmetric “tails” indicating a sinistral sense of shear. Gympie region. Queensland.
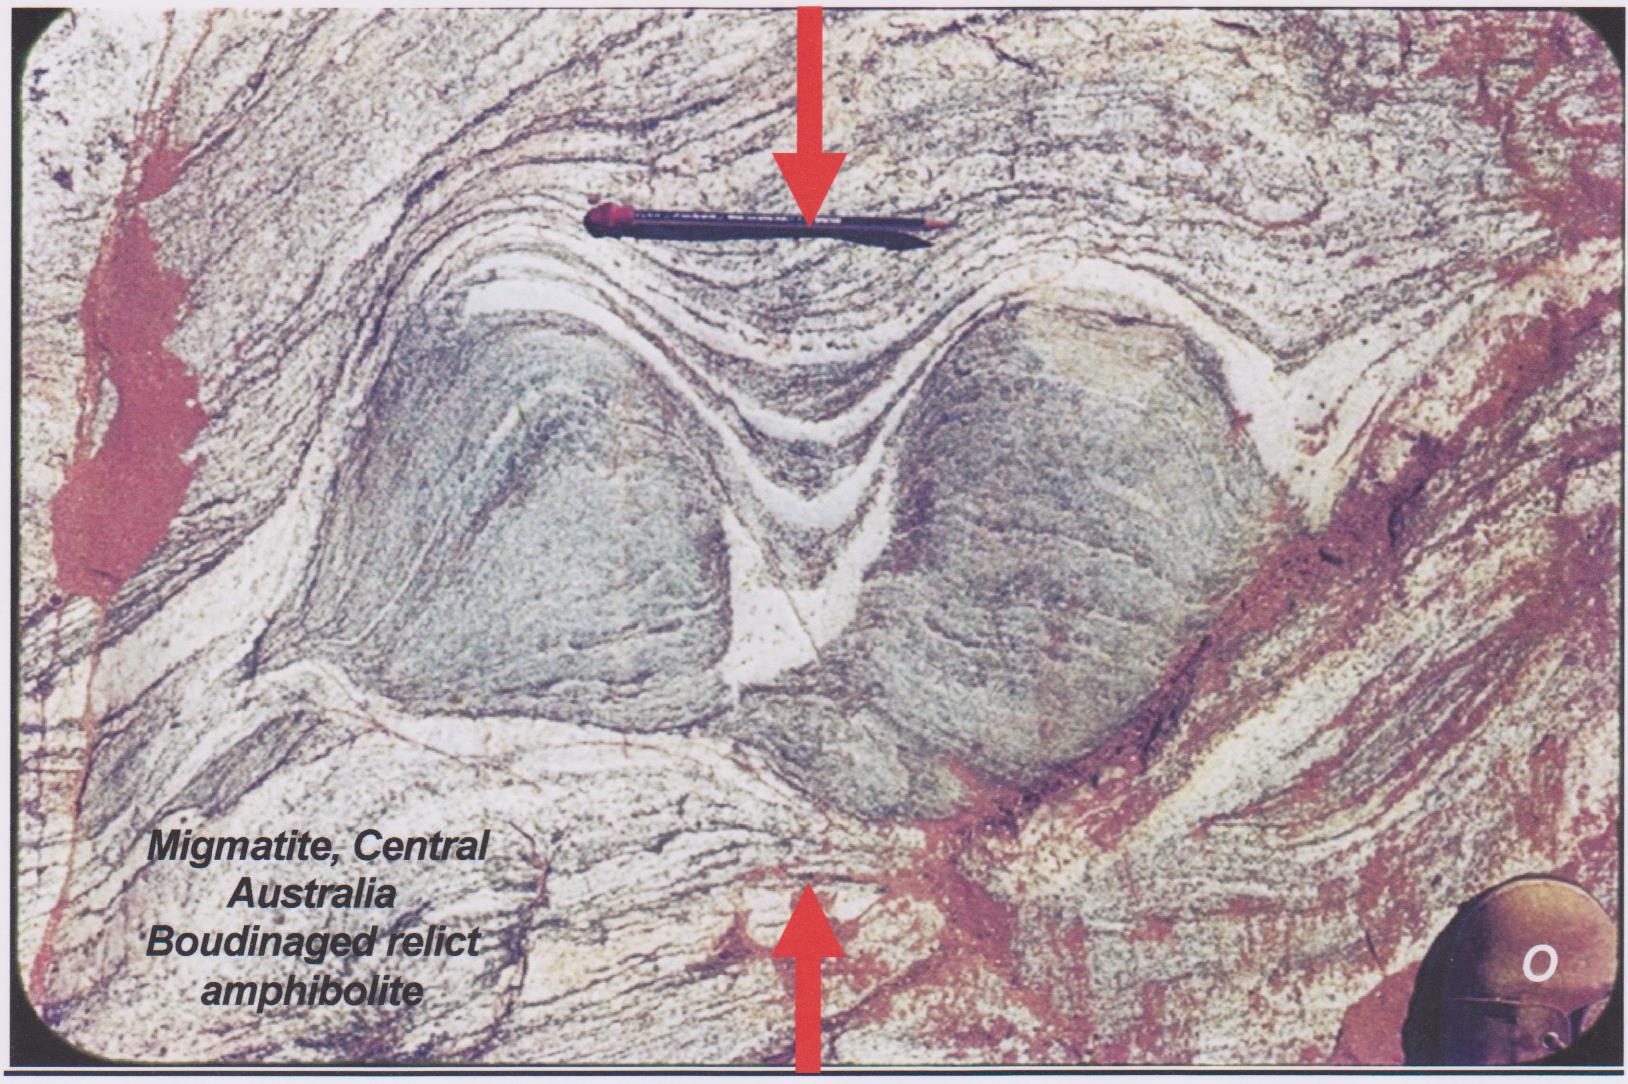
O. An amphibolite in a migmatite zone has resisted ductile deformation and partial melting. The amphibolite has broken into separate fragments. In the low-strain zones between the fragments thick zones of quartz-feldspar have grown. Another example of boudinage. Pure flattening strain only.
All comments, questions even crticisms are welcome. Please email me using the details under the “contact” tab.