Producing a geological map is a process of problem solving. One of the best ways to approach problem solving is known as the system of multiple working hypotheses. Something of a buzz phrase in all sciences nowadays, not many know that the idea was first formulated in the writings of geologist Thomas Crowther Chamberlin in 1897[1]. In geological mapping, using multiple working hypotheses means that the geologist does not start the field work with a completely blank mind, but armed with ideas about the geology which has to be mapped. These ideas are developed from looking at published maps, from interpreting air photos, satellite images or aeromagnetic data or even by following an intuitive hunch. From these ideas or hypotheses, predictions are made: areas are then selected and observations are made which will most effectively test these predictions. Sometimes this will involve walking selected traverses across strike, sometimes following a marker horizon or contact, sometimes a more irregular search pattern. The mapping sequence depends on the postulated geology: strong linear strike continuity usually indicates that across strike traversing is the best approach; complex folding or faulting is best resolved by following marker horizons, and so on. In any case, the early working hypotheses will certainly contain several alternative scenarios and may not be precisely formulated; to check them out a very wide range of field observations will have to be made and a mix of different search patterns may need to be followed. The geologist at this stage must be open to all possible ideas, hypotheses and observations. If the observations do not fit the hypotheses, then new hypotheses must be constructed or old ones modified to accommodate the observations. These new hypotheses are then tested in their turn, and so the process is repeated.
With each step in the process the predictions become more precise and the search pattern more focused on to the key areas of interest. These are the usually areas where significant boundary conditions can be defined in the outcrop. Most of the time of the intelligent mapper is thus spent in the areas of “fertile” outcrop where there is most to be learned, and less time is spent in those areas where the rocks are uniform ‑ in the latter areas a lower density of observation will serve.
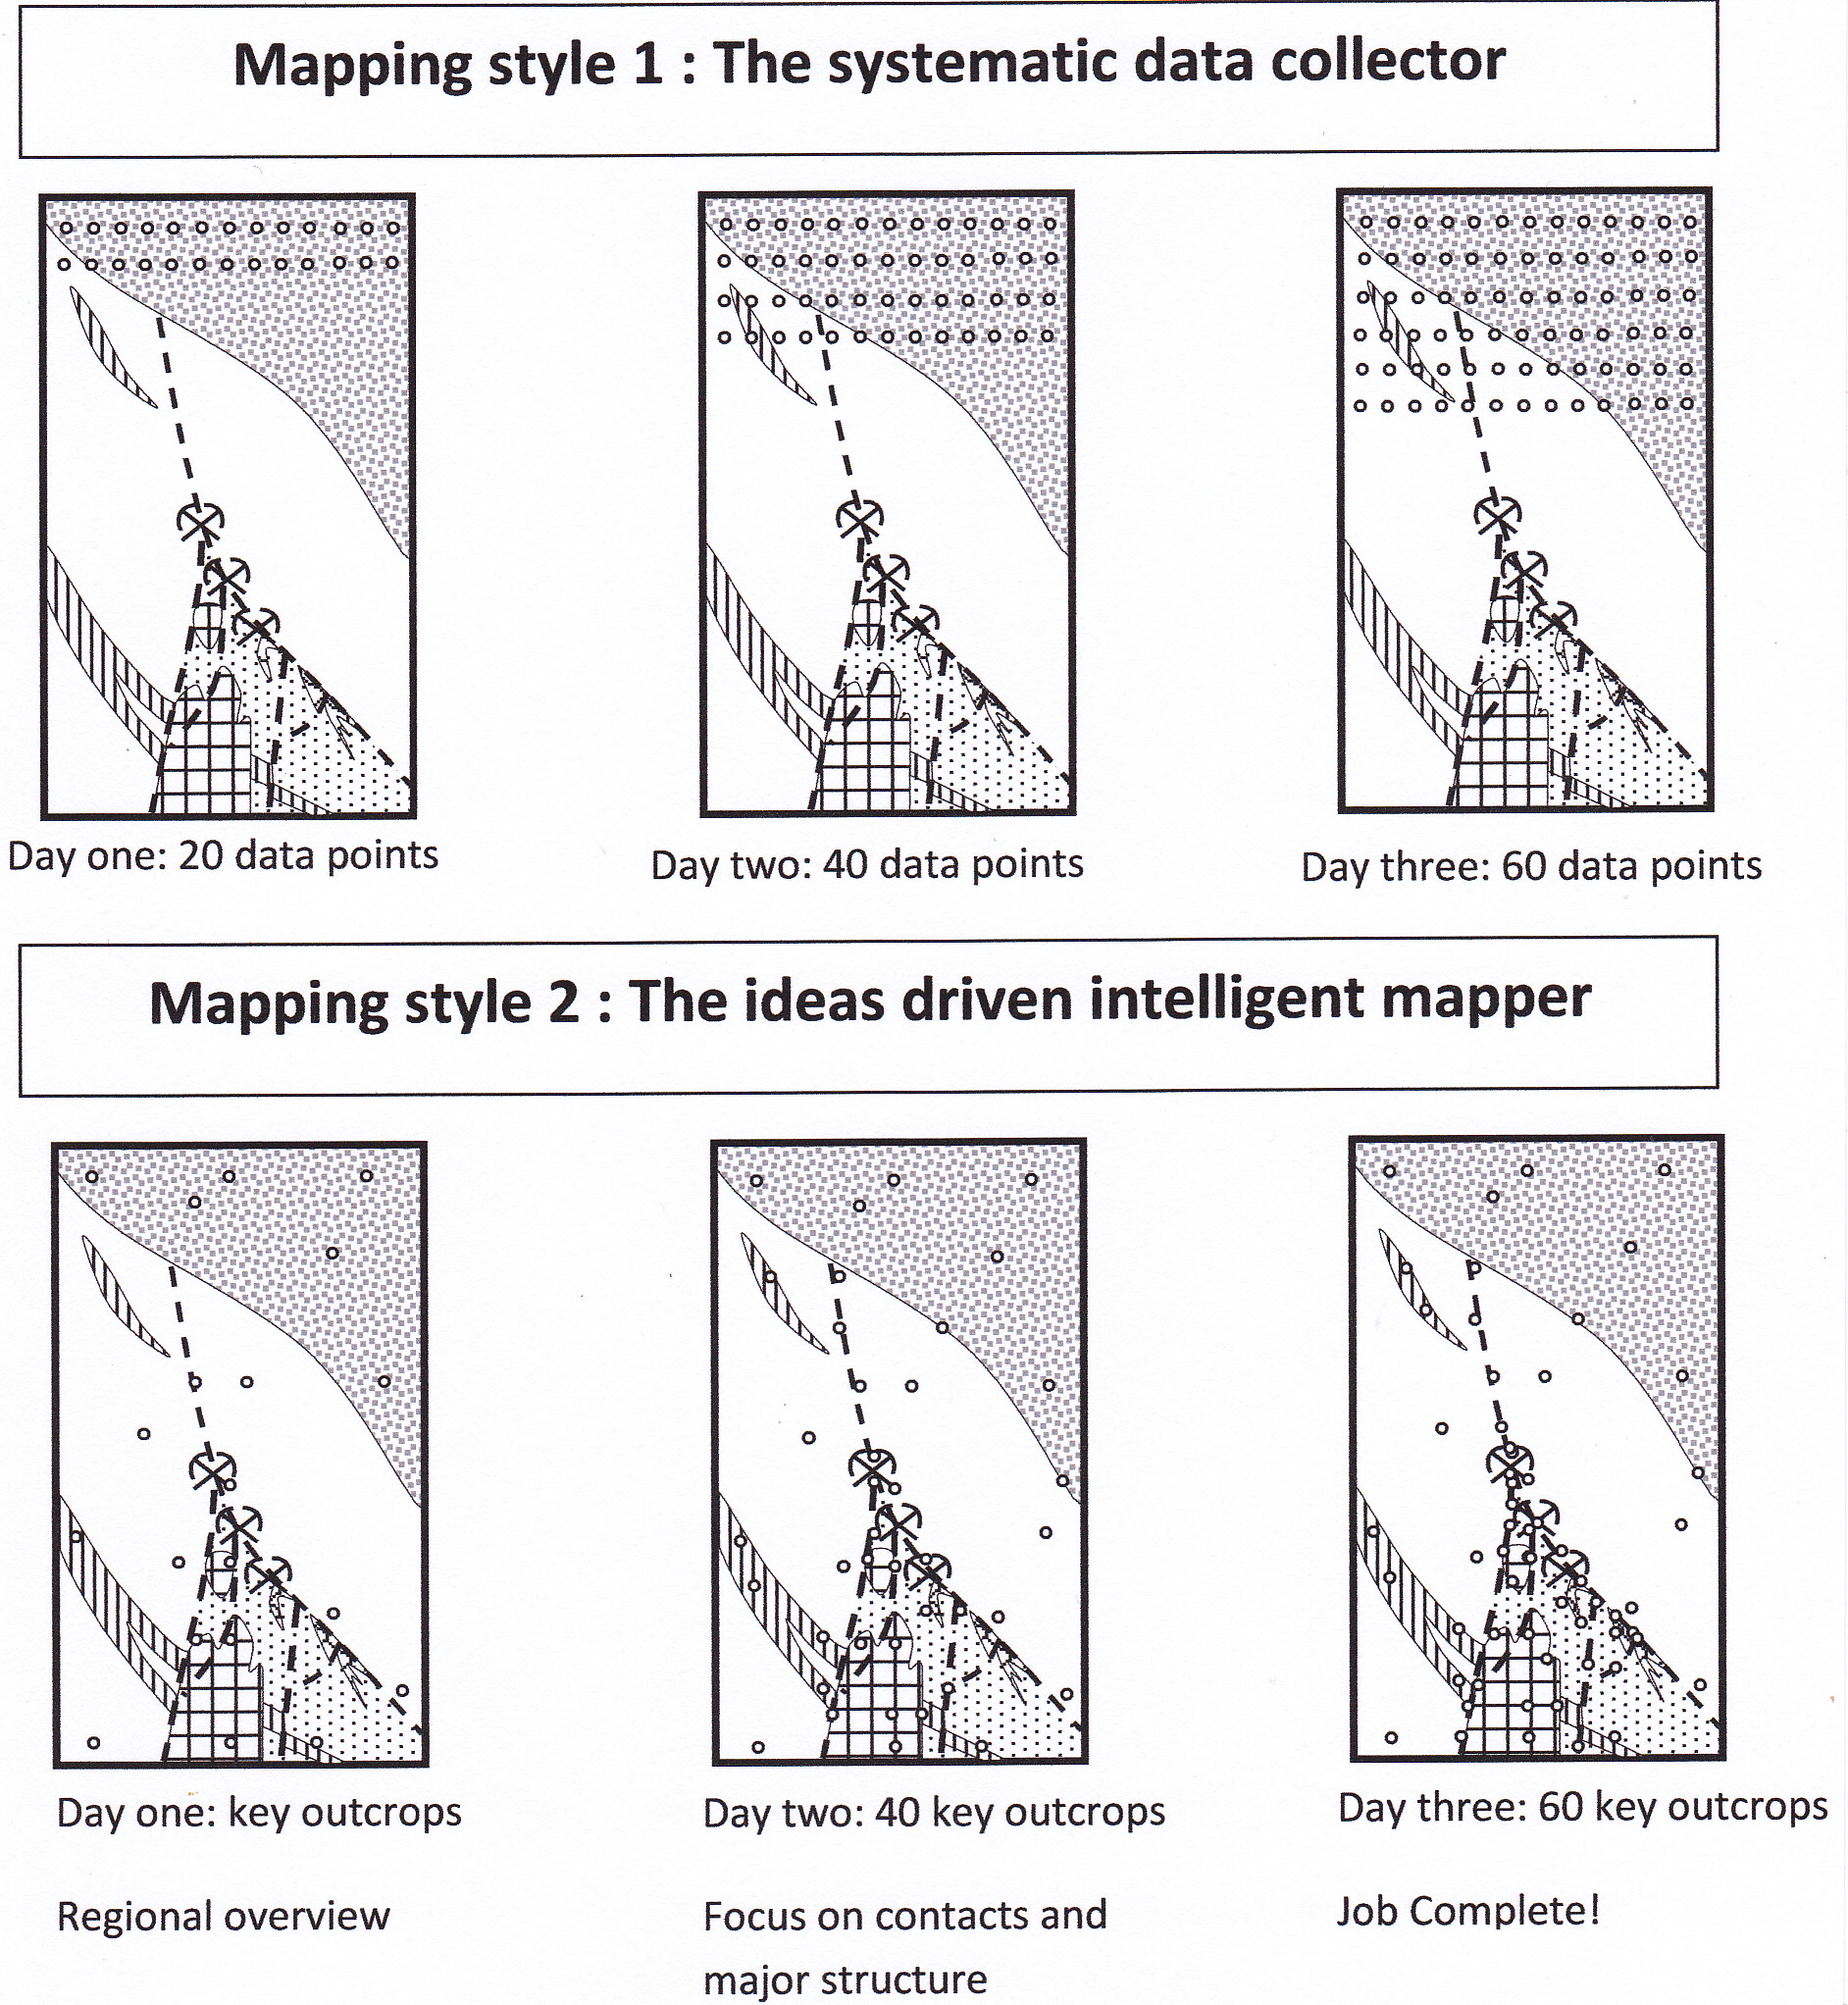
In the figure below, the progress of the systematic but mindless data collector – let’s call him the MINDLESS SLOGGER (top row of maps) and the ideas-driven INTELLIGENT MAPPER (bottom map row) in the production of a geological map are compared by using dots to show the location of the sequence of observations that each of the two types of mapper might make upon the hypothetical (and assumed perfect) finished geological map.
Many small structural features can be observed in individual outcrop or hand specimens that allow predictions to be made about large structures occurring at the scale of a map. Most useful of such observations are the predictable geometrical relationships that occur between bedding, cleavages, lineations and folds, as well as movement indicators that can be used to deduce the sense of movement on brittle faults and ductile shear zones. Where such structures as these occur, they are a boon to the field mapper, and he should learn to recognize and make use of them. A detailed description of these structures is beyond the scope of this blog but they are treated in many standard geology textbooks of structural geology.
Another aspect of rocks is the way the features and relationships seen in hand specimen or outcrop often exactly mirror features occurring at map scale. This has been informally called “Pumpelly’s Rule” after Raphael Pumpelly, the nineteenth century USGS geologist who first described it[2]. Once again the intelligent mapper will be on the lookout for such potential relationships in outcrop as a means of developing ideas as to the map scale geological patterns.
With geochemistry having a major role in most modern exploration programmes, the geological map will usually play a large part in the planning and understanding the results of surface geochemical sampling programmes. In order to fulfil this role, exploration geological mapping in most cases will need to carefully show the distribution of superficial and weathered rock units (the regolith), as well as bedrock features.
Observations are thus not made randomly, nor are they collected on a regular grid or according to a fixed search pattern. If one was kind, this type of mapping could be called “a systematic data collection” – a less kind (and more accurate) description would be a “mindless slogging”. The best (most intelligent) technique is to make those observations that will most effectively prove[3] or disprove the current ideas. By doing this, mapping proceeds rapidly and most time is spent on areas of interest. Geological mapping is a scientific process and when carried out properly corresponds to the classic scientific method: theorizing, making predictions from the theories, and designing experiments (planning the required field observations) to test the predictions[4].
An aspect of this technique is that thinking and theorizing are constantly being done while field work proceeds. In other words, data collection is not a separate and earlier phase from data interpretation; these two aspects are inextricably linked and must proceed together. Above all, observation and interpretation should never come to be regarded as “field work” and “office work”[5]
[1] Thomas Chrowder Chamberlin :1897. Studies for students: the method of multiple working hypotheses. J Geol. 5(8) 837-848.
[2] Today we recognize that geological processes are essentially chaotic (i.e. non‑linear). Such systems typically exhibit what is called “scale invariance”, meaning there is a repetition of characteristic patterns at different scales ‑ the example often quoted being the comparison in shape between a rock pool and the coastline of which it is an element. In geology a good example is the style and asymmetry of outcrop-scale folds which mimic map scale folds on whose limbs they occur. Pumpelly’s Rule is an early recognition of this type of relationship (see Pumpelly et al. 1884: Geology of the Green Mountains. USGS Memoir 23: 157p).
[3] Actually, as pointed out by the philosopher of science Karl Popper in his much-quoted book “The logic of scientific discovery” (1934), an experiment either falsifies a hypothesis or expands the range of conditions under which it can be said to hold good: it can never prove it.
[4] All theories in science, and that includes ideas on geology, must be formulated in such a way that they are capable of being falsified. For example, for field mapping purposes it is not very useful to postulate that “these outcrops constitute a metamorphic core complex” because there is no simple field observation which can falsify that statement. Rather postulate “this outcrop is felsic gneiss, that outcrop is sandstone, this contact is a mylonite” – if these turn out to be false then the hypothesis may need revision.
[5] In our society from the earliest training we are unfortunately conditioned to think indoors, and to enjoy less cerebral pursuits outdoors. It is a syndrome that the field geologist must learn to break.