Air photographs (along with other similar remote sensed products such as satellite and radar imagery) provide both a mapping base on which to record field observations and an integrated view of landscape on which map-scale patterns of lithology and structure can be directly observed or interpreted. Where available at a suitable scale and resolution, they are the pre-eminent medium upon which to construct a geological map.
For any geological mapping programme making use of remote sensed imagery, image interpretation represents the idea generating, integrative, control and planning phases of that programme. The initial interpretation made from the images will provide:
- definition of areas of outcrop and areas of superficial cover;
- preliminary geological interpretation based on topographic features, drainage patterns, colours and textures of rocks, soils and vegetation, trend lines of linear features, etc.;
- geological hypotheses for field checking;
- selection of the best areas to test these hypotheses;
- familiarity with the topography and access routes to assist in logistic planning of the field programme – access roads and tracks, fording points for streams and gullies, potential helicopter landing sites, etc.
- Selection of features which might indicate economic mineralisation
Air photo or satellite image interpretation needs to be carried out before, during and after the field phases of the mapping process. Obviously, detailed interpretation making use of stereo viewing can be most conveniently done at an office desk, but, as ideas change or evolve, interpretation of photo/image features will have to be attempted in the field as well.
Since making and interpreting geological observations on the photo and outcrop are two aspects of the same process, they should ideally be carried out by the same person[1]. Whenever possible, the field geologist should do his own interpretation.
Geological interpretation of remote sensed imagery complements field mapping and should never be regarded as an adequate substitute for it.
Skills required for the geological interpretation of remote sensed imagery are very much the same as those needed for field mapping. The geologists who are best at it are those who have spent most time in the field, and are familiar with the types of rocks and styles and patterns of structure that are relevant to the area being examined. They are also the geologists who know the likely surface expression of all these features and the nature of the weathering and regolith processes of the area being examined. This may all sound rather daunting for the inexperienced geologist. Faced with a remote sensed image of a portion of land surface it can be difficult to know where to start to create the geological map. However, while there is no short cut for experience, there is a rule-of-thumb procedure for tackling this problem. That procedure is the subject of this post.
A landscape is the end product of a succession of geological processes. The oldest rocks have undergone all these processes so are likely to have the most complex shape and form: the youngest rocks will only have been affected by the last geological process to have operated in the area and so are probably relatively simple. When faced with a any complex multi-faceted problem it is always a good idea to begin with the easy bits and move progressively to the more complex. In other words, begin your geological interpretation with the youngest rocks. This gets you started, and boosts confidence. You can then move on progressively to the older elements of the geology.
The youngest rocks in any area are the recent surface covers caused by present day weathering and sedimentation processes. Alluvium, colluvium, scree slopes, surface chemical accumulations (laterite, calcrete, silcrete), wind-blown sand and so on. These are generally obvious and can be readily outlined on your map. Remember, we are talking here about the preliminary interpretation map – the one you produce to guide your field work. Best to use a pencil for your interpretation as you may want to revise these lines after you have been in the field. As you outline the areas of young recent cover, this is also good time to become familiar with the topography of the area, to plot access routes and so on. Signs of human activity relevant to your search can also be plotted – old mine sites or prospecting pits, quarries etc…
After this first pass interpretation, your map might look something like the one below. This map represents Stage One in the preliminary geological interpretation of an air photo scene covering a semi-arid area in Australia. Our map is now divided into two broad manageable areas: those of superficial deposits and those of bedrock potentially at or near the surface.
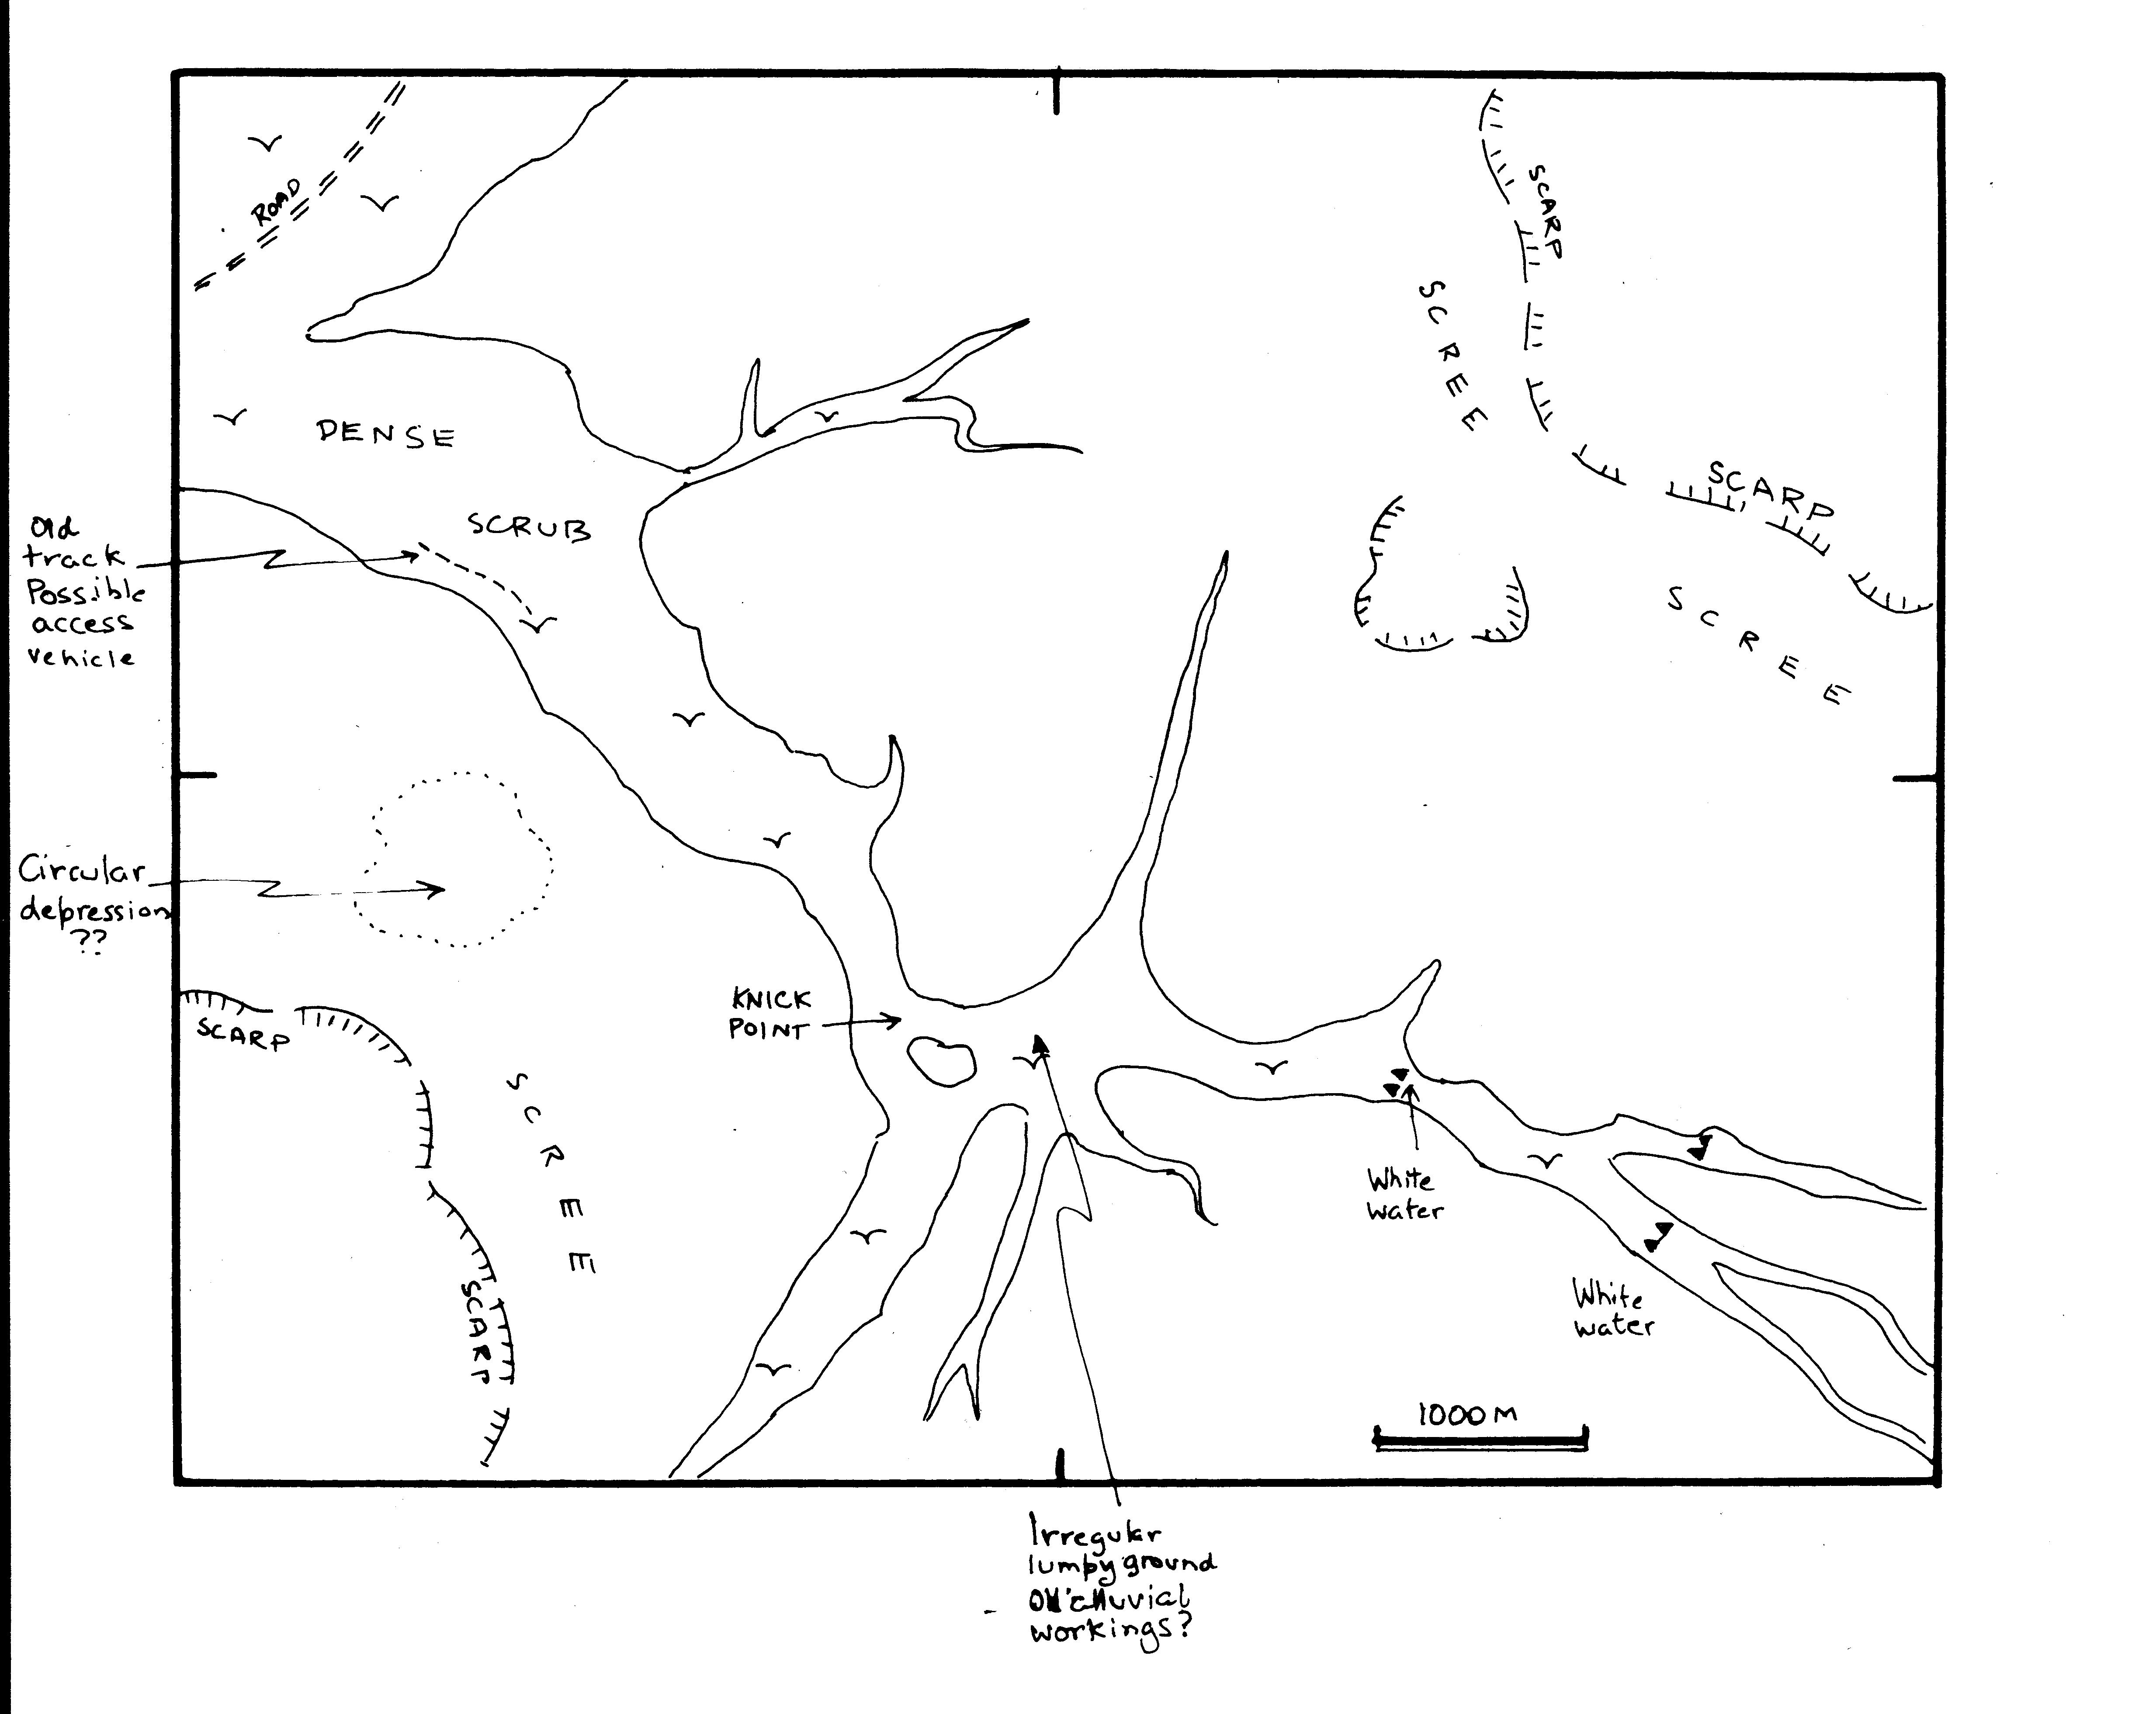
STAGE ONE – PRELIMINARY GEOLOGICAL INTERPRETATION: Regolith Units
Now we can start to concentrate on the bedrock areas. We look for what might be the youngest and simplest elements of this terrain – straight through going features that might represent faults or dykes. Pencil these in with some preliminary identification. Now look for any broad divisions of the area based on differing landforms, vegetation cover, drainage patterns, textures, colours etc.. In some cases it will be obvious what these major bedrock divisions represent. In other cases identification might have to await subsequent field work. In the map that I am using as an example, it is fairly clear that the high ground to the NE and SW is occupied by a young flat-lying sedimentary sequence that is probably unconformable upon older rocks that form the lower slopes. To the west of the major creek, prominent orthogonal joint sets and rounded outcrop shapes suggest a granite intrusive. Use continuous lines to outline the boundaries of these major landscape divisions (even if you do not know what they are at this stage). Use light, broken, dash lines for trends of parallel features in the bed rock (already we are beginning to suspect bedding). More continuous light lines can be used for prominent joints or joint sets. Do not hesitate to mark down what you see – these are only ideas for field checking. Your identifications can be changed and the lines modified. If you do not know what something is, think of all possible alternatives could be: these are multiple working hypotheses to guide field observation.
As you scan the image, make careful note of anything that might be indicative of, or related to, economic mineralisation. Things to look out for include:
- Landslips (areas of argillic alteration)
- Quartz veins or areas of quartz float.
- White water in streams indicating bars of hard rock (silicification, quartz veins?)
- Former mineral workings or signs prospecting activity (mines, pits, quarries, costeans, lumpy uneven ground, drill sites, drill access tracks, camp sites)
- Dark-coloured (or any unusually coloured) rocks (gossanous, mineral stained ?)
- Anomalous positive or negative topographic features – especially those that cut across the normal grain of the rocks.
- Vegetation anomalies (unusual soil chemistry)
After this stage my example map now has the appearance shown below:
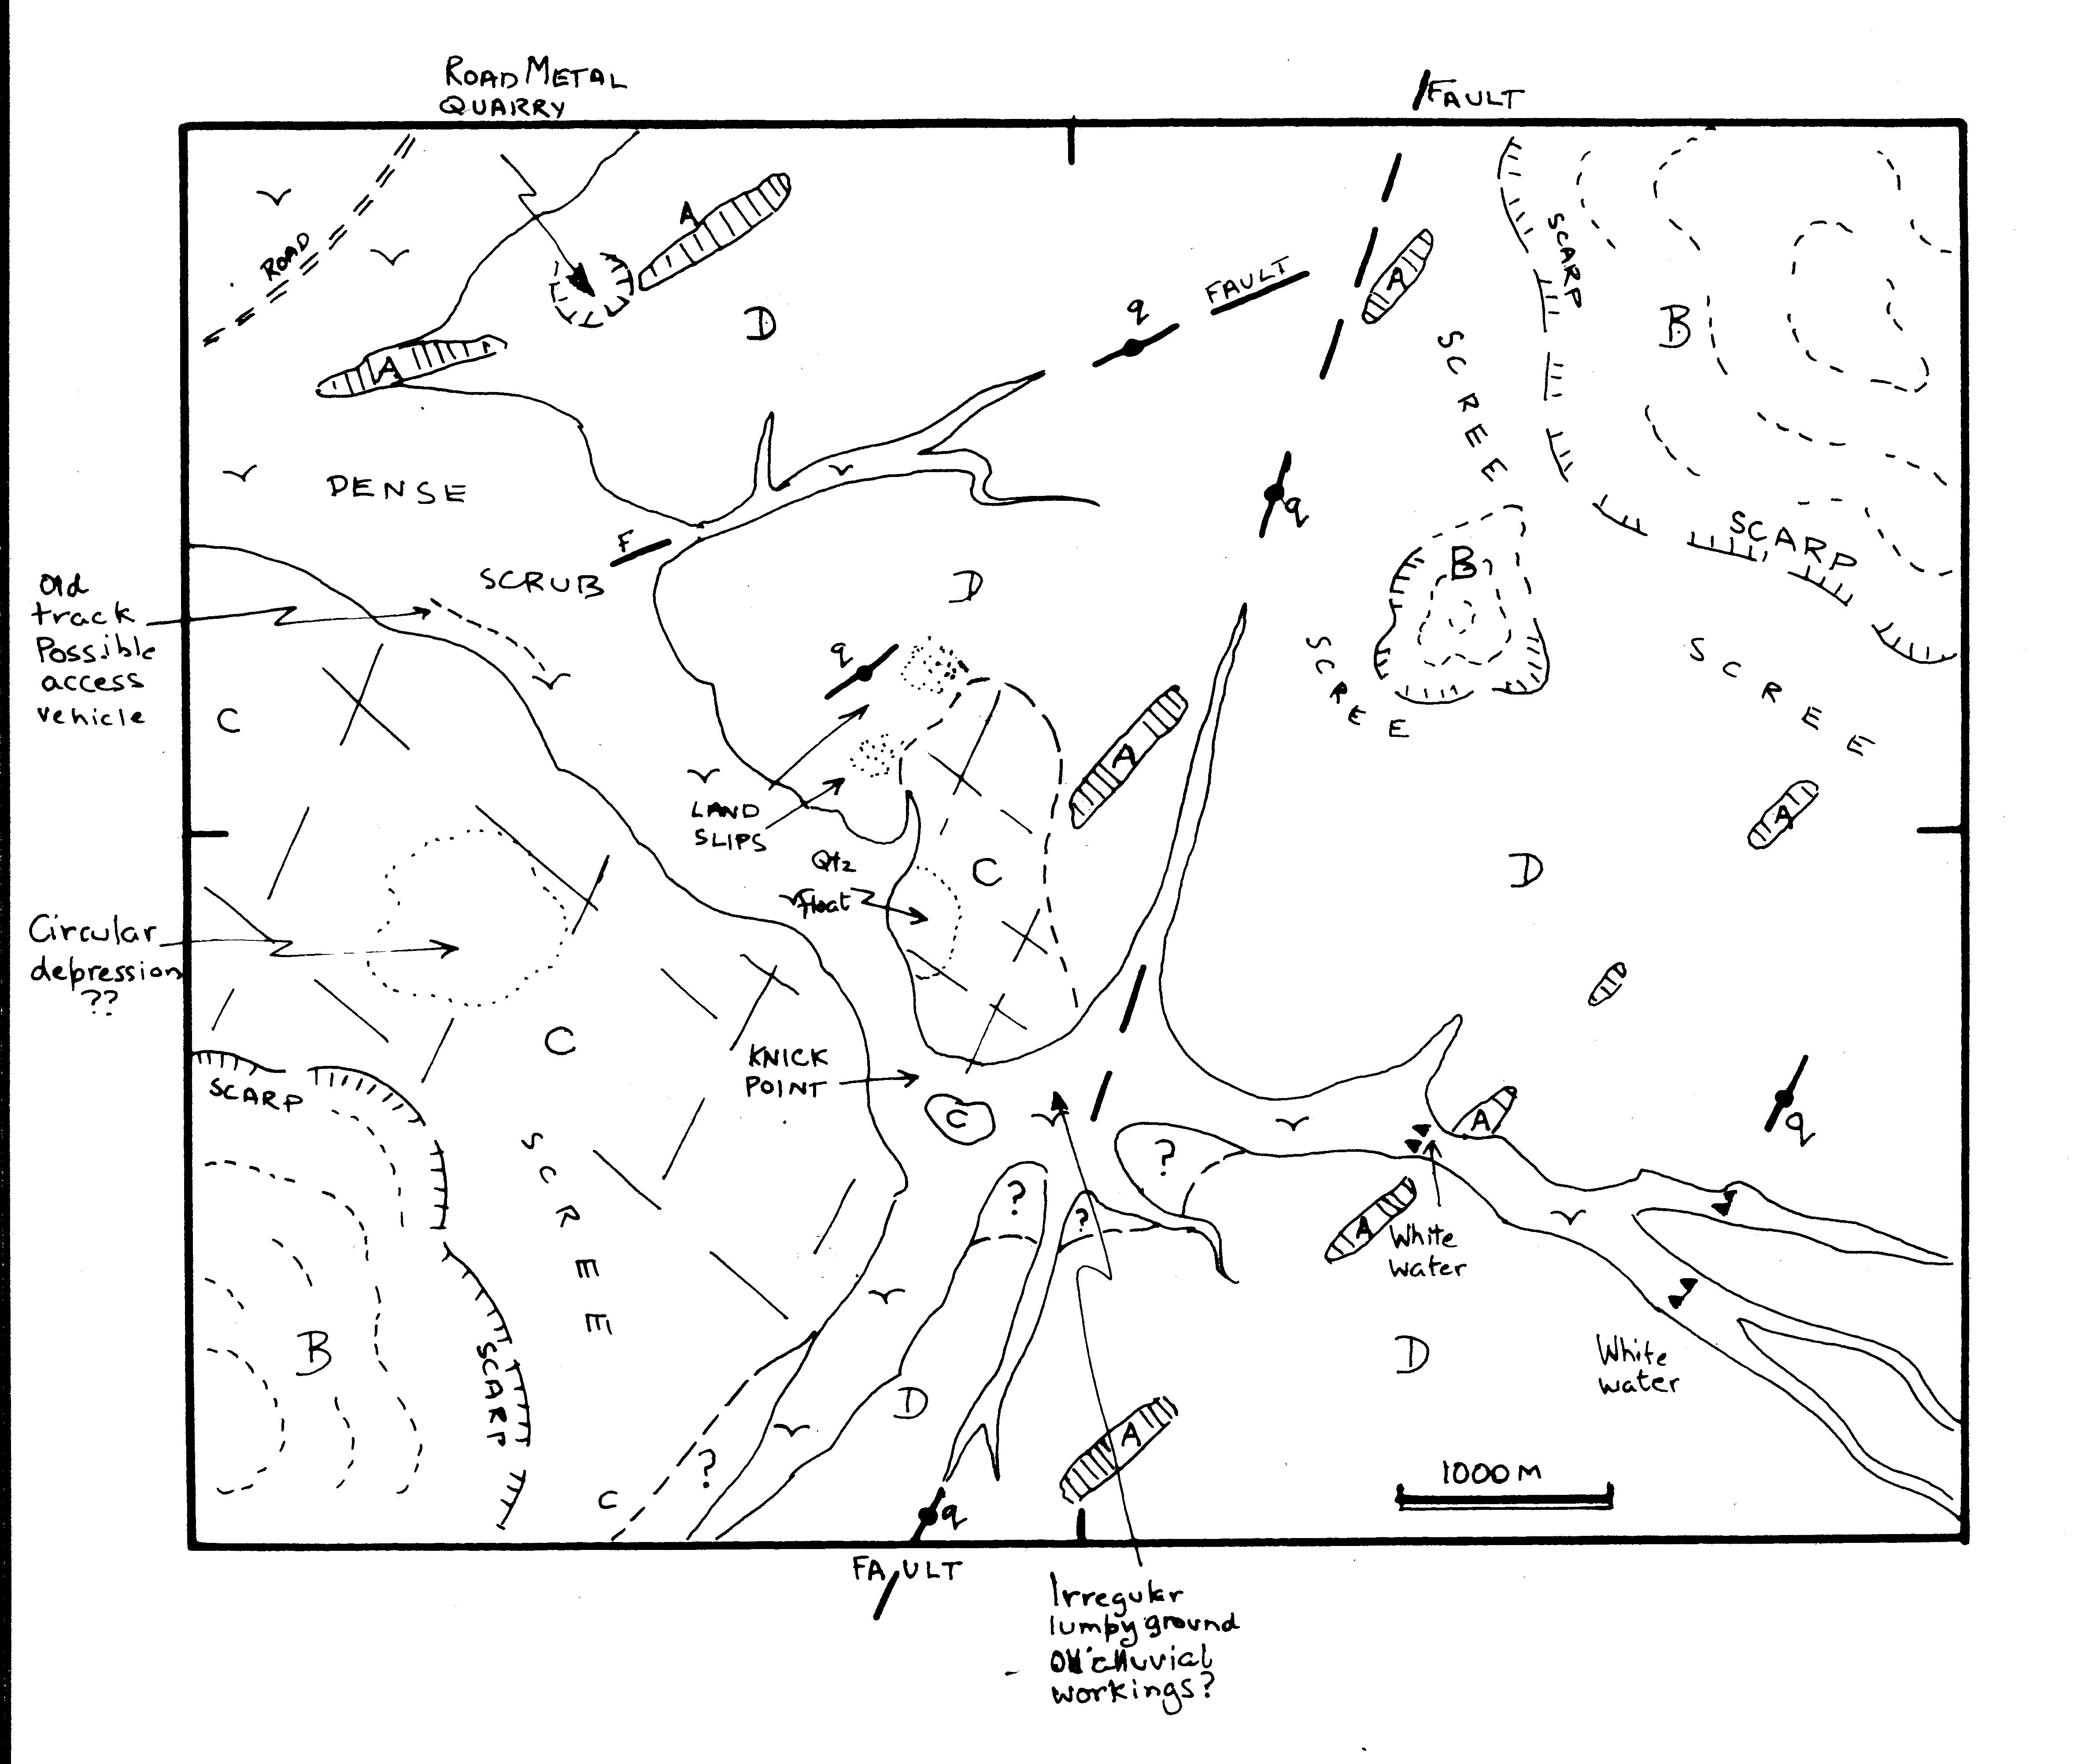
STAGE TWO PRELIMINARY GEOLOGICAL INTERPRETATION: Young bedrock features
Now, with most of distractions of regolith, late faults etc. out of the way, we can concentrate on the detail the oldest rocks of the area. In our particular example, these are a layered sequence (we assume sedimentary bedding) that runs NW-SE through the centre of the area. By plotting detailed trend lines we try to pull out elements of this sequence on the basis of distinctive appearance or outcrop. At this stage, awaiting field checks, these units will probably be identified by numbers or letters. The pattern is complicated: the rocks are folded: they are displaced by faults, cut by igneous dykes and plutons, but we are in a good position to resolve this complexity because the faults and dykes and plutons, as younger elements, have already been plotted on our map.
Where the layered sequence outcrops on steep slopes (the sides of cross-cutting valleys) we look for evidence of amount and direction of dip (you may need high power on your stereoscope for this). A warning here, almost all 3D imagery of landscapes exaggerates the vertical dimension so dips of strata will look much steeper than they actually are. The best you can hope for is a qualitative dip estimate – as in flat, shallow, moderate, steep or vertical. Appropriate dip symbols for image interpretation can be used.
Key outcrops or areas of outcrop are noted where field observation will best resolve problems.
Your preliminary map, now in its final pre-field work form, might now look somewhat like our example below. It will contain some observations whose meaning you are fairly certain, many observations that are tentative and speculative.
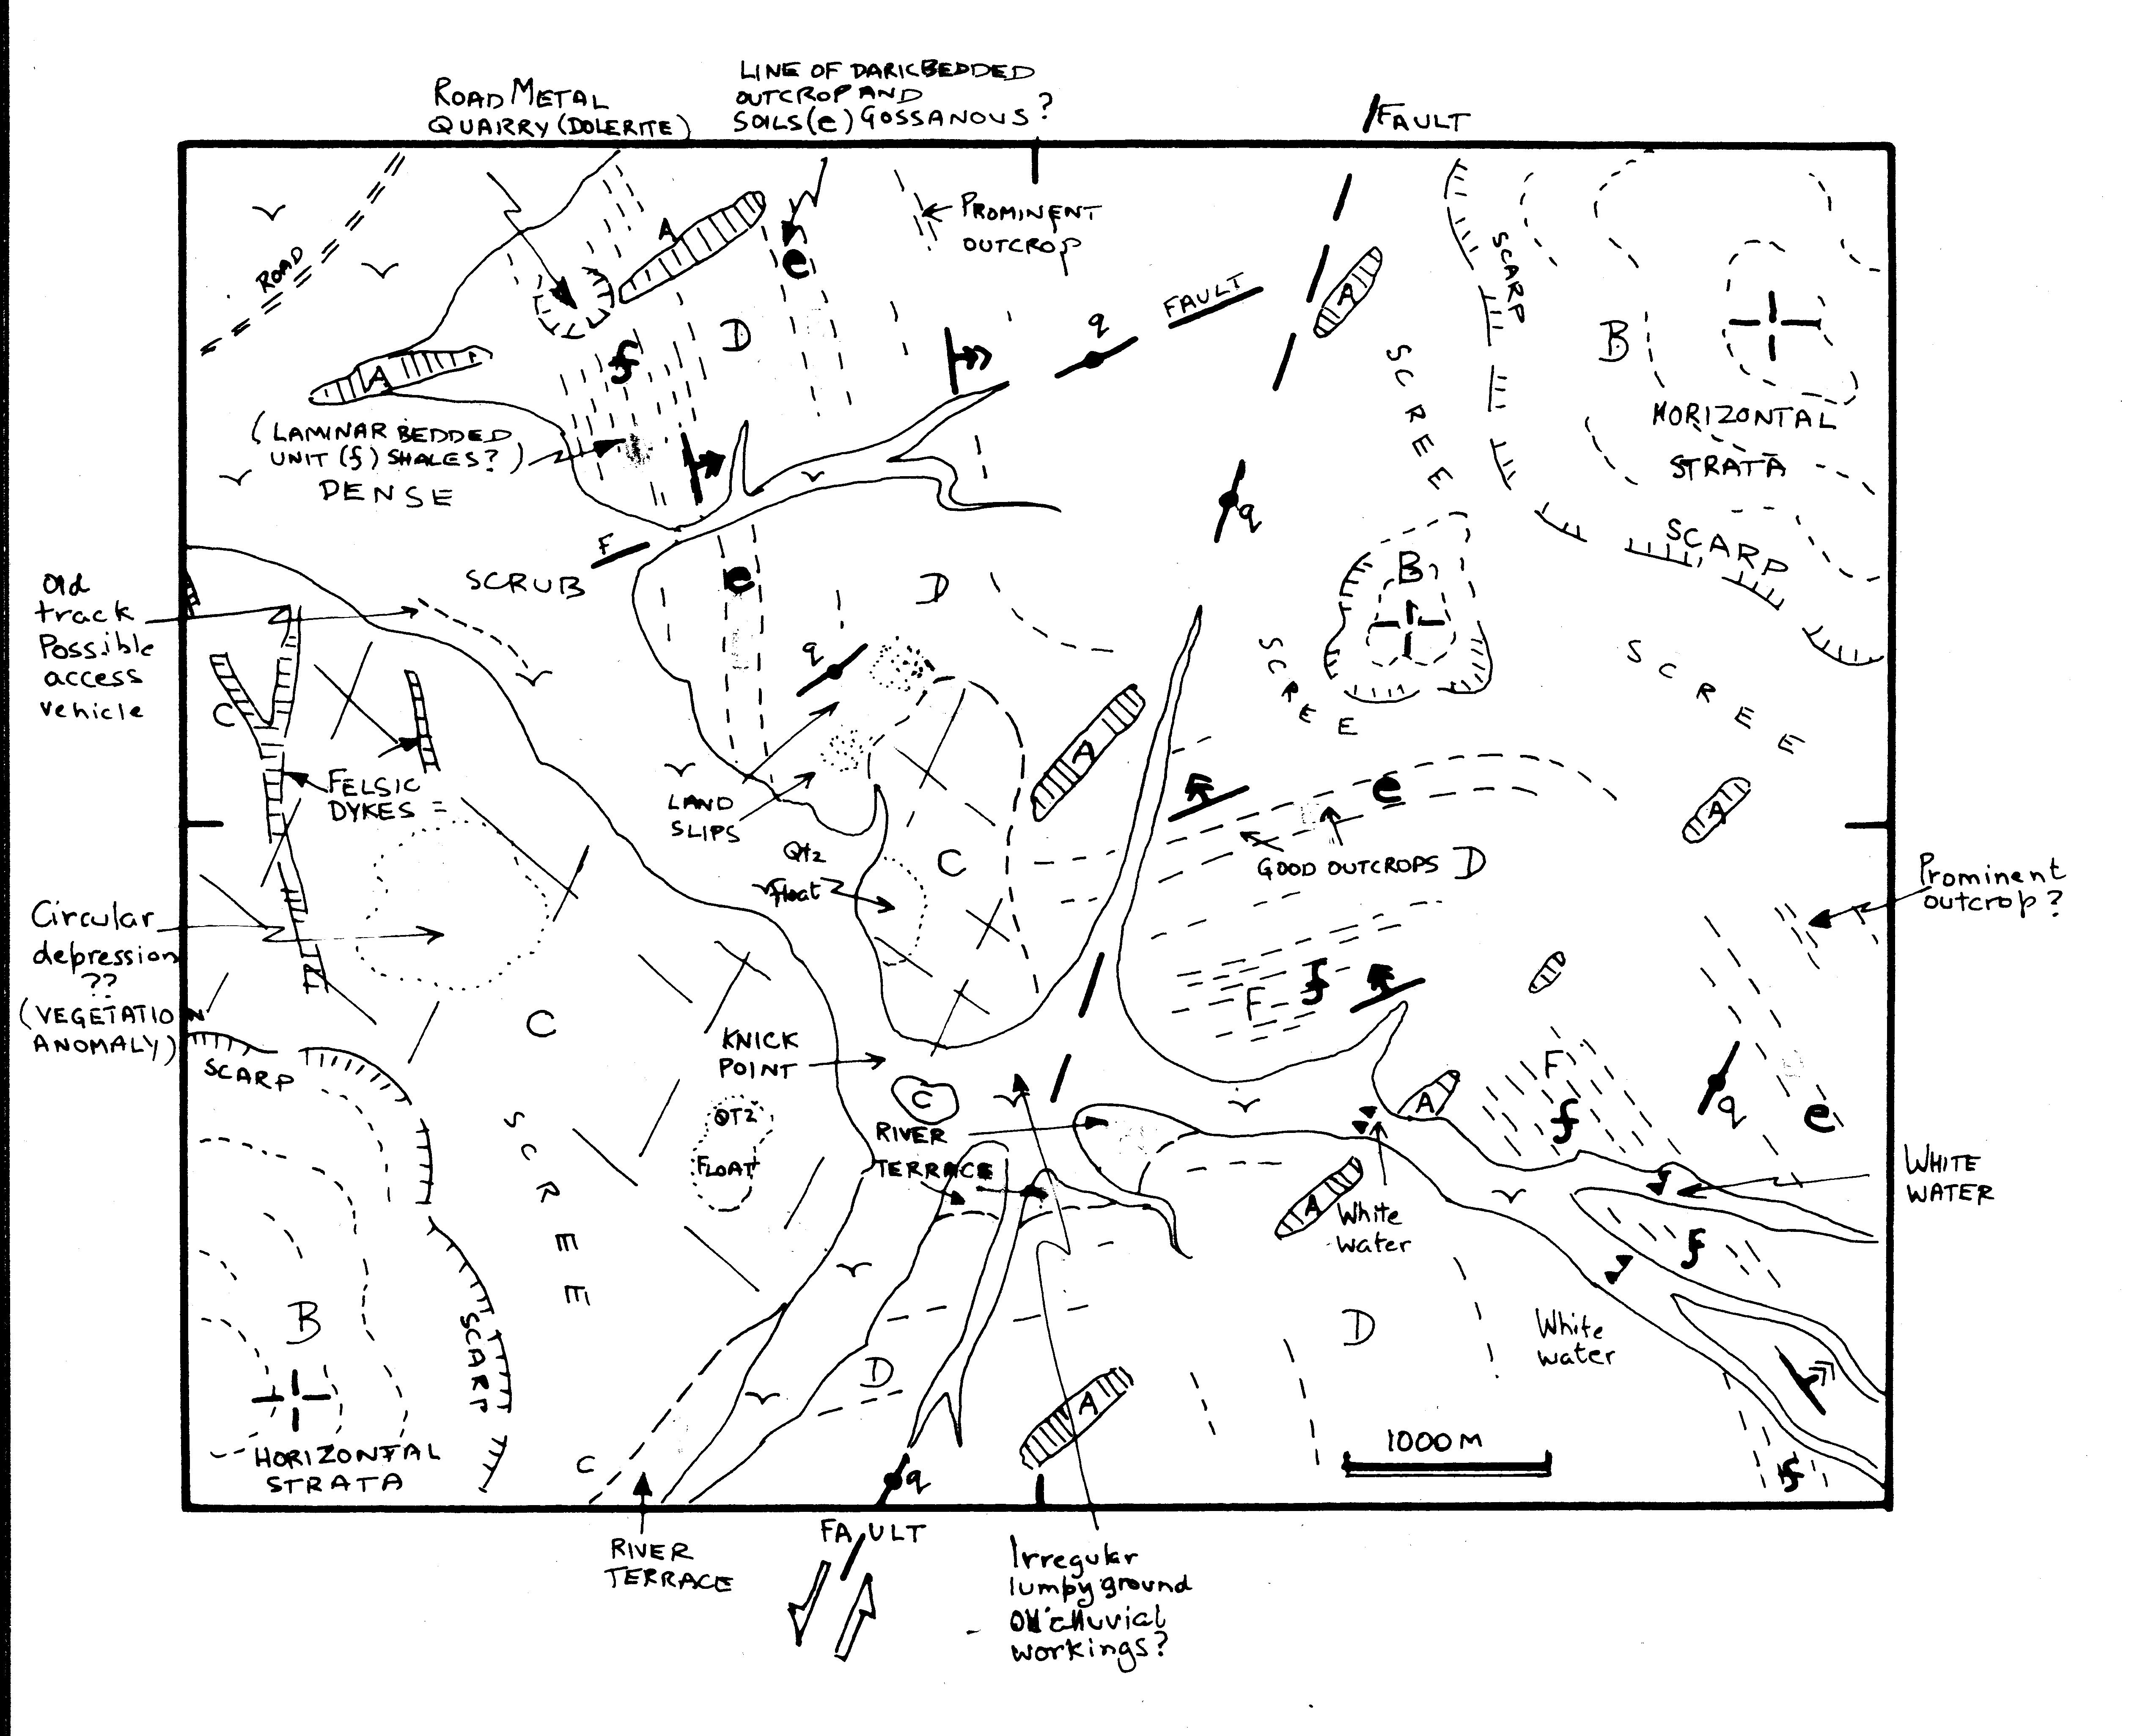
STAGE THREE PRELIMINARY GEOLOGICAL INTERPRETATION: Older bedrock features
In the course of field work and after field work most of the questions generated in the preliminary interpretation stages will, hopefully, be answered. Field observations may well generate new ideas which will have to be used to guide further image interpretation and a new set of field observations.
Eventually, a final office based image interpretation, integrates all observations and ideas on the geology of the area, adds fine detail, tidies up the line work and provides a clean copy for drafting.
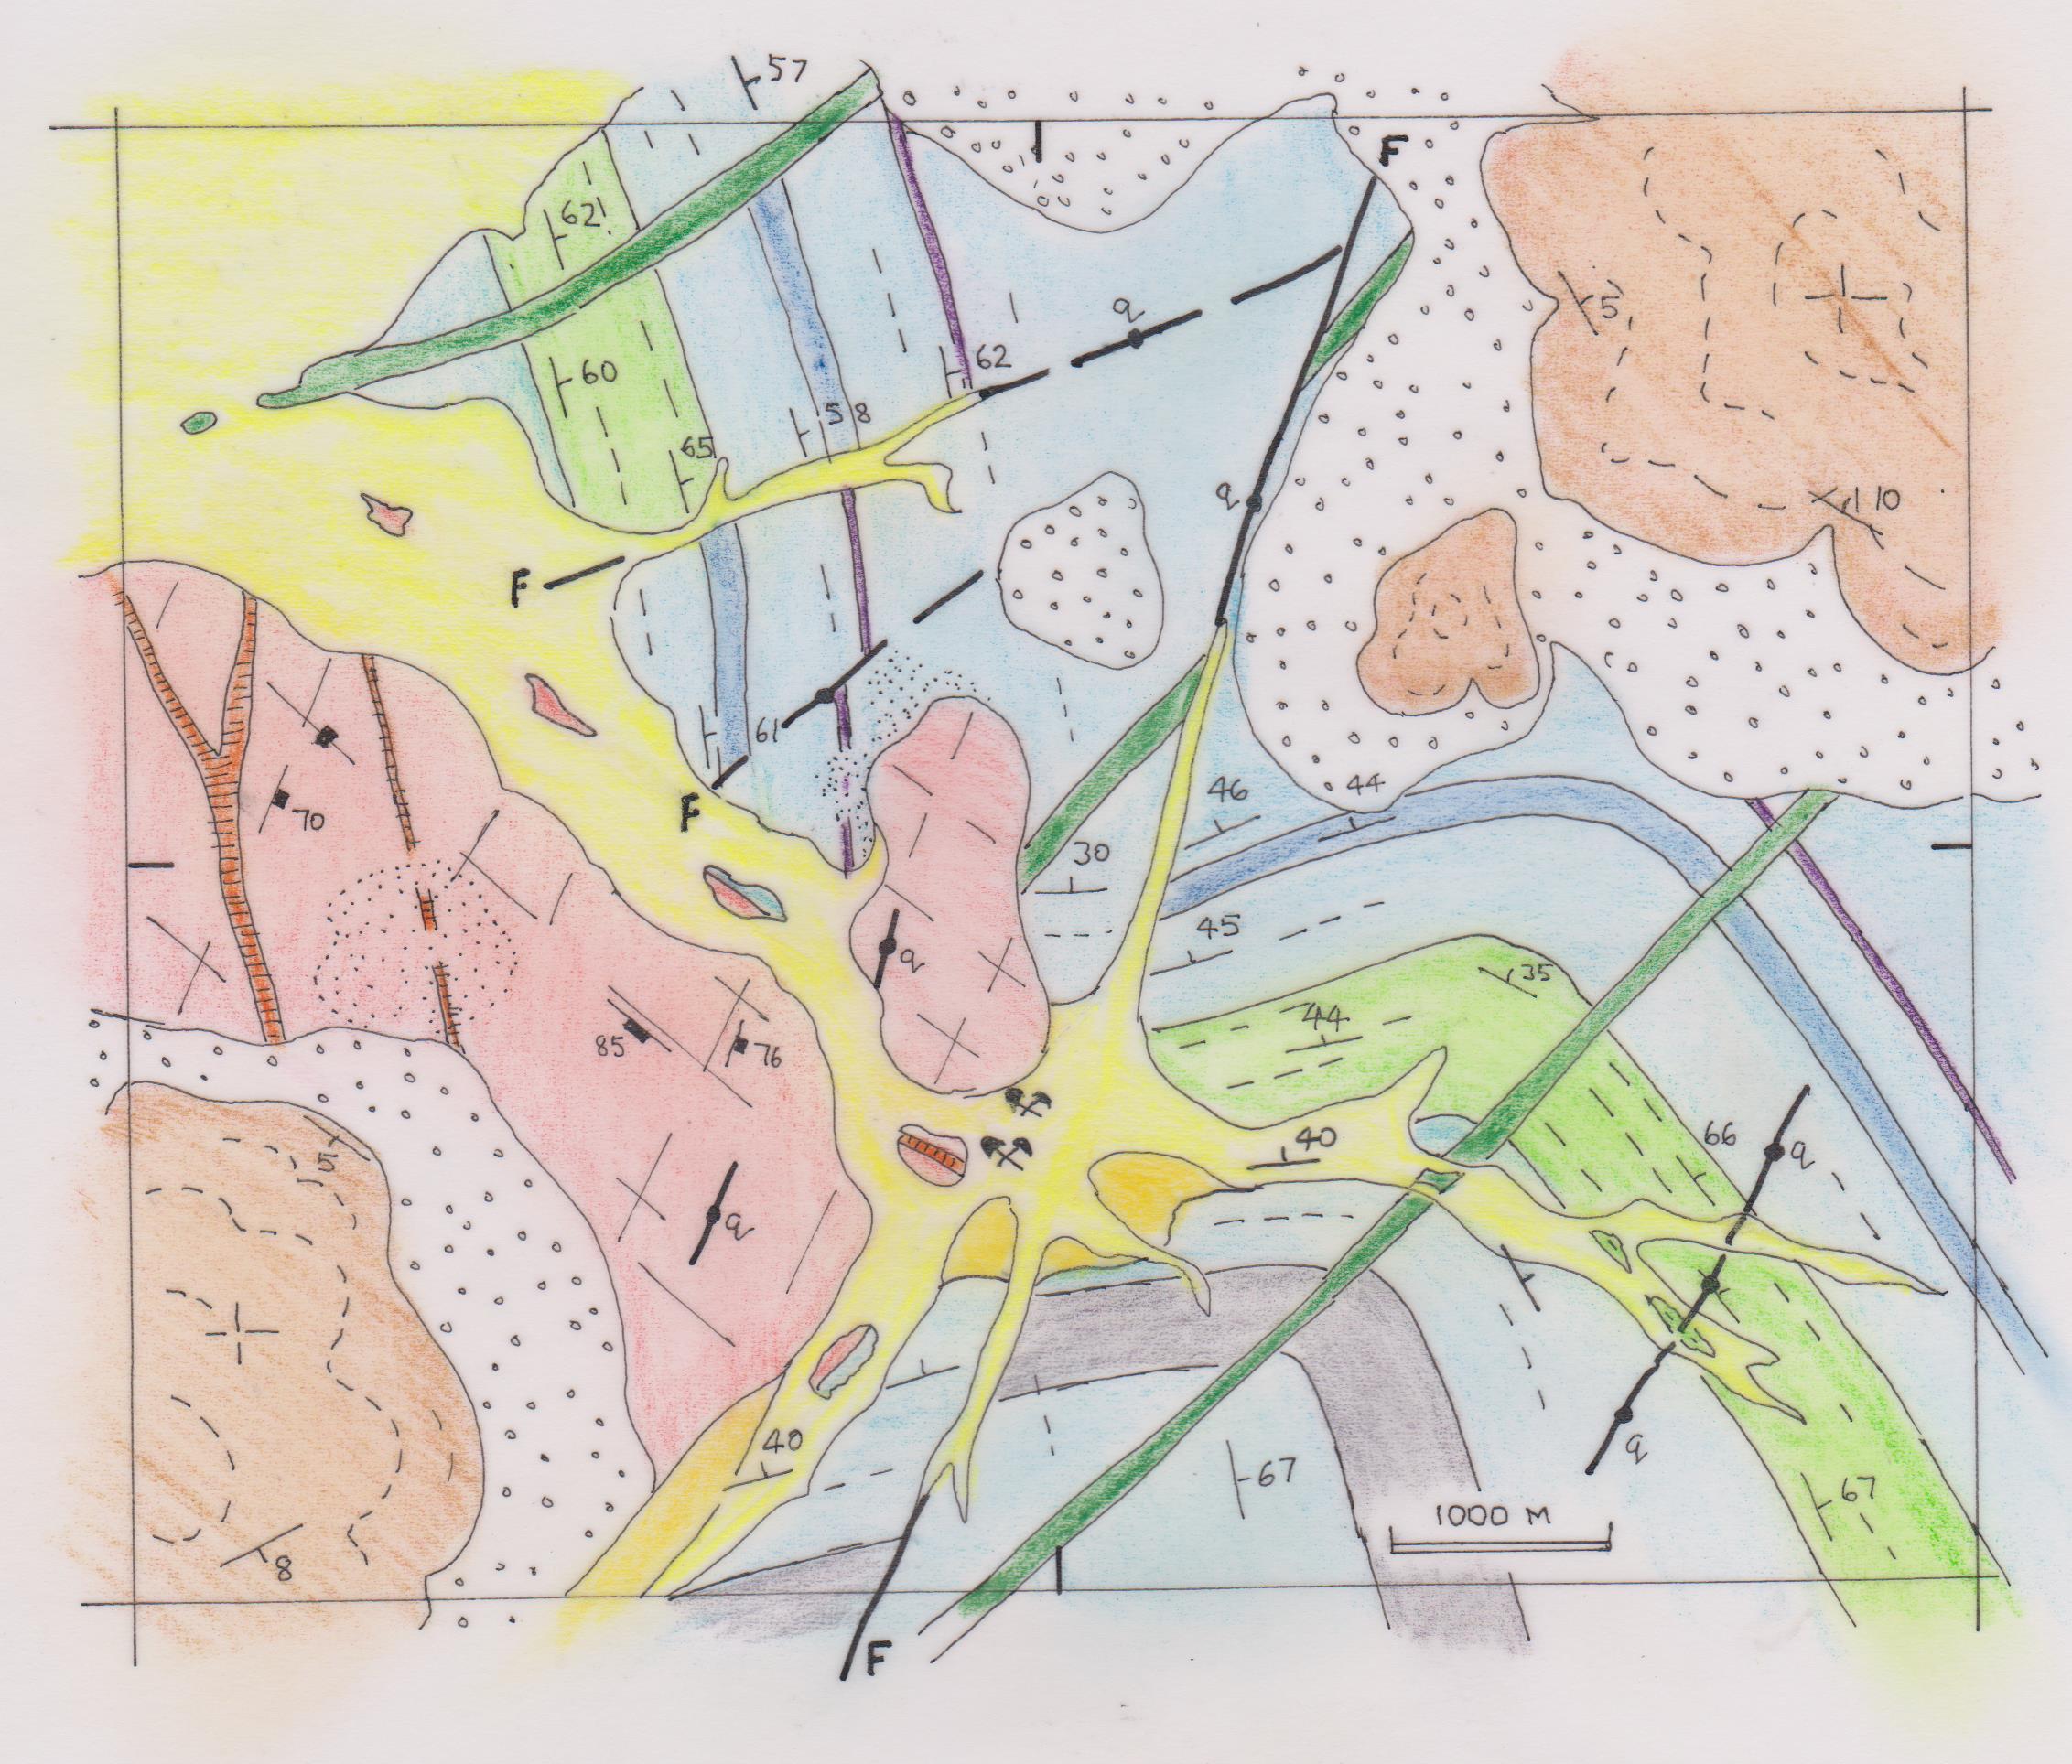
END STAGE GEOLOGICAL MAP AFTER FIELD WORK AND FINAL INTERPRETATION; Ready for drafting
[1] Highly skilled and experienced geologists are available who specialize in the field of air photo and satellite image interpretation. Their use is indicated for training purposes; where they have particular knowledge of the geology or landforms in the area to be mapped; or where there is little possibility of any substantial field access to the region.