Exploration for a mineral deposit begins with generating prospects which can then be tested with a staged series of exploration programs that hopefully will lead to ore discovery and eventually a mine. Obviously not all prospects that are generated will make it through to a mine. In fact, by far the majority will be discarded at the early exploration stages of target generation and target drilling stages. Of the small numbers that survive to detailed evaluation drilling, only a few will reach feasibility stage, and even they may fail at this last hurdle. The total number of prospects that have to be initially generated in order to provide one new mine discovery will vary according to many factors (some of these are discussed below) but will generally be a large number. Some idea of what is involved in locating an ore body can be gained by considering a prospect wastage or exploration curve (see figure below). This is a graph on which the number of prospects in any given exploration play (the vertical axis) is plotted against the exploration stage reached or against time, which is the same thing (the horizontal axis). The large number of prospects initially generated decline through the exploration stages in an exponential manner indicated by the prospect wastage curve. On the figure, the curve labelled A represents a successful exploration play resulting in an ore body discovery. The curve labelled C represents another successful exploration play, but in this case, although fewer prospects were initially generated, the slope of the line is much less than for play A. It can be deduced that the prospects generated for play C must have been generally of higher quality than the prospects of play A because a higher percentage of them survived the initial exploration stages. The line B is a more typical prospect wastage curve: that of a failed exploration play.
THE PROSPECT WASTAGE CURVE
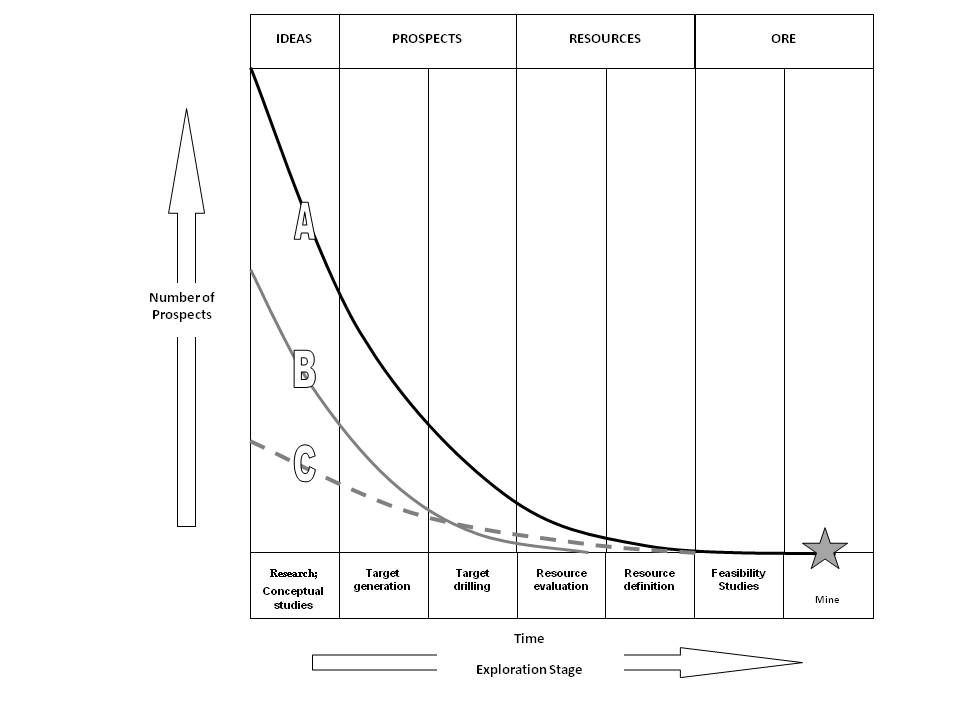
These curves show how, for any given exploration programme, the number of prospects decreases in an exponential way through the various exploration stages. In a programme based largely on empirical methods of exploration (curve A), a large number of prospects are initially generated; most of these are quickly eliminated. In a largely conceptual exploration program (curve C), a smaller number of prospects are generated, but these will be of a generally higher quality. Most programmes (B) will fall somewhere between these two curves.
It should be clear from the prospect wastage curve that there are only two ways to turn an unsuccessful exploration program into a successful one; the exploration program either has to start with a larger input of prospects or the explorationist has to get smarter (that is: decrease the rate of prospect wastage and hence the slope of the exploration curve). There is of course a third way – to get luckier
Getting bigger does not necessarily mean that the exploration company has to hire more explorationists (although, in the current downturn, it would be nice if they did) and spending money at a faster rate. Prospects are generated over time, so the injunction to get bigger can also read as “get bigger and/or hang in there longer”. There is, however, usually a limit to the number of worthwhile prospects which can be generated in any given exploration programme or exploration play. The limits are not always (or even normally) in the ideas or anomalies that can be generated by the explorer, but more often are to be found in the confidence of the explorationist or perhaps, more particularly, in the confidence of those who pay the bills. This factor is often referred to as “project fatigue”. Another common limiting factor is the availability of ground for exploration.
In the industry, examples are legion of groups who explored an area and failed to find the ore body subsequently located there by someone else, because, in spite of good ideas and good exploration programmes, the earlier groups simply gave up too soon. We have now reached what is probably the most important decision point that any mineral explorer ever has to make : whether to persist with an unsuccessful exploration programme or to cut one’s losses and try some other province. Beware the day when Jeremiahs in the company say – “we don’t want to throw good money after bad” and remember that Western Mining Corporation had 11 years of unsuccessful copper exploration in the Stuart Shelf before their drill hit the Olympic Dam mega deposit. Sheer dogged persistence and an uniquely WMC brand of self-confidence bordering on arrogance got them there[1].
The smart explorationist will generate the best quality prospects and test them in the most efficient and cost‑effective manner. At the same time, she will maintain a balance between generation and testing so as to maintain a continuous flow of directed activity leading to ore discovery. The achievement of a good rollover rate of prospects is a sign of a healthy exploration programme.
DIFFERENT TYPES OF EXPLORATION STRATEGY
The exploration curve provides a convenient way of illustrating another aspect of the present day exploration process. Some regional exploration methods involve widespread systematic collection of geophysical or geochemical measurements and typically result in the production of large numbers of anomalies. This is an empirical exploration style. Generally little will be known about any of these anomalies other than the fact of their existence, but any one anomaly could reflect an ore body and must be regarded as a prospect to be followed up with a preliminary assessment – usually a field visit. Relatively few anomalies will survive the initial assessment process. The exploration curve for a programme that makes use of empirical prospect generation will therefore have a very steep slope and look something like the upper curve (A) of the figure.
The opposite type of prospect generation involves applying the theories of ore‑forming processes to the known geology and mineralization of a region, so as to predict where ore might be found. This is a conceptual exploration approach. Conceptual exploration will generally lead to only a small number of prospects being defined. These are much more likely to be “quality” prospects, in the sense that the chances are higher that any one of these prospects will contain an ore body compared to prospects generated by broad-brush empirical methods. An exploration play based on conceptual target generation will have a relatively flat exploration curve and will tend to resemble the lower line (curve C) on the prospect wastage graph.
Empirical and conceptual generation and targeting are two end members of a spectrum of exploration techniques, and few actual exploration programmes would be characterized as purely one or the other. Conceptual generation and targeting tends to play a major role where there are high levels of regional geological knowledge and the style of mineralization sought is relatively well understood. Such conditions usually apply in established and well‑known mining camps such as (for example) the Kambalda area in the Eastern Goldfields of Western Australia, IOCG[2] exploration on the Stuart Shelf of South Australia, the Noranda camp in the Canadian Abitibi Province or the Bushveld region of South Africa. Empirical techniques tend to play a greater role in greenfield[3] exploration programmes, where the levels of regional geological knowledge are much lower and applicable mineralisation models less well defined.
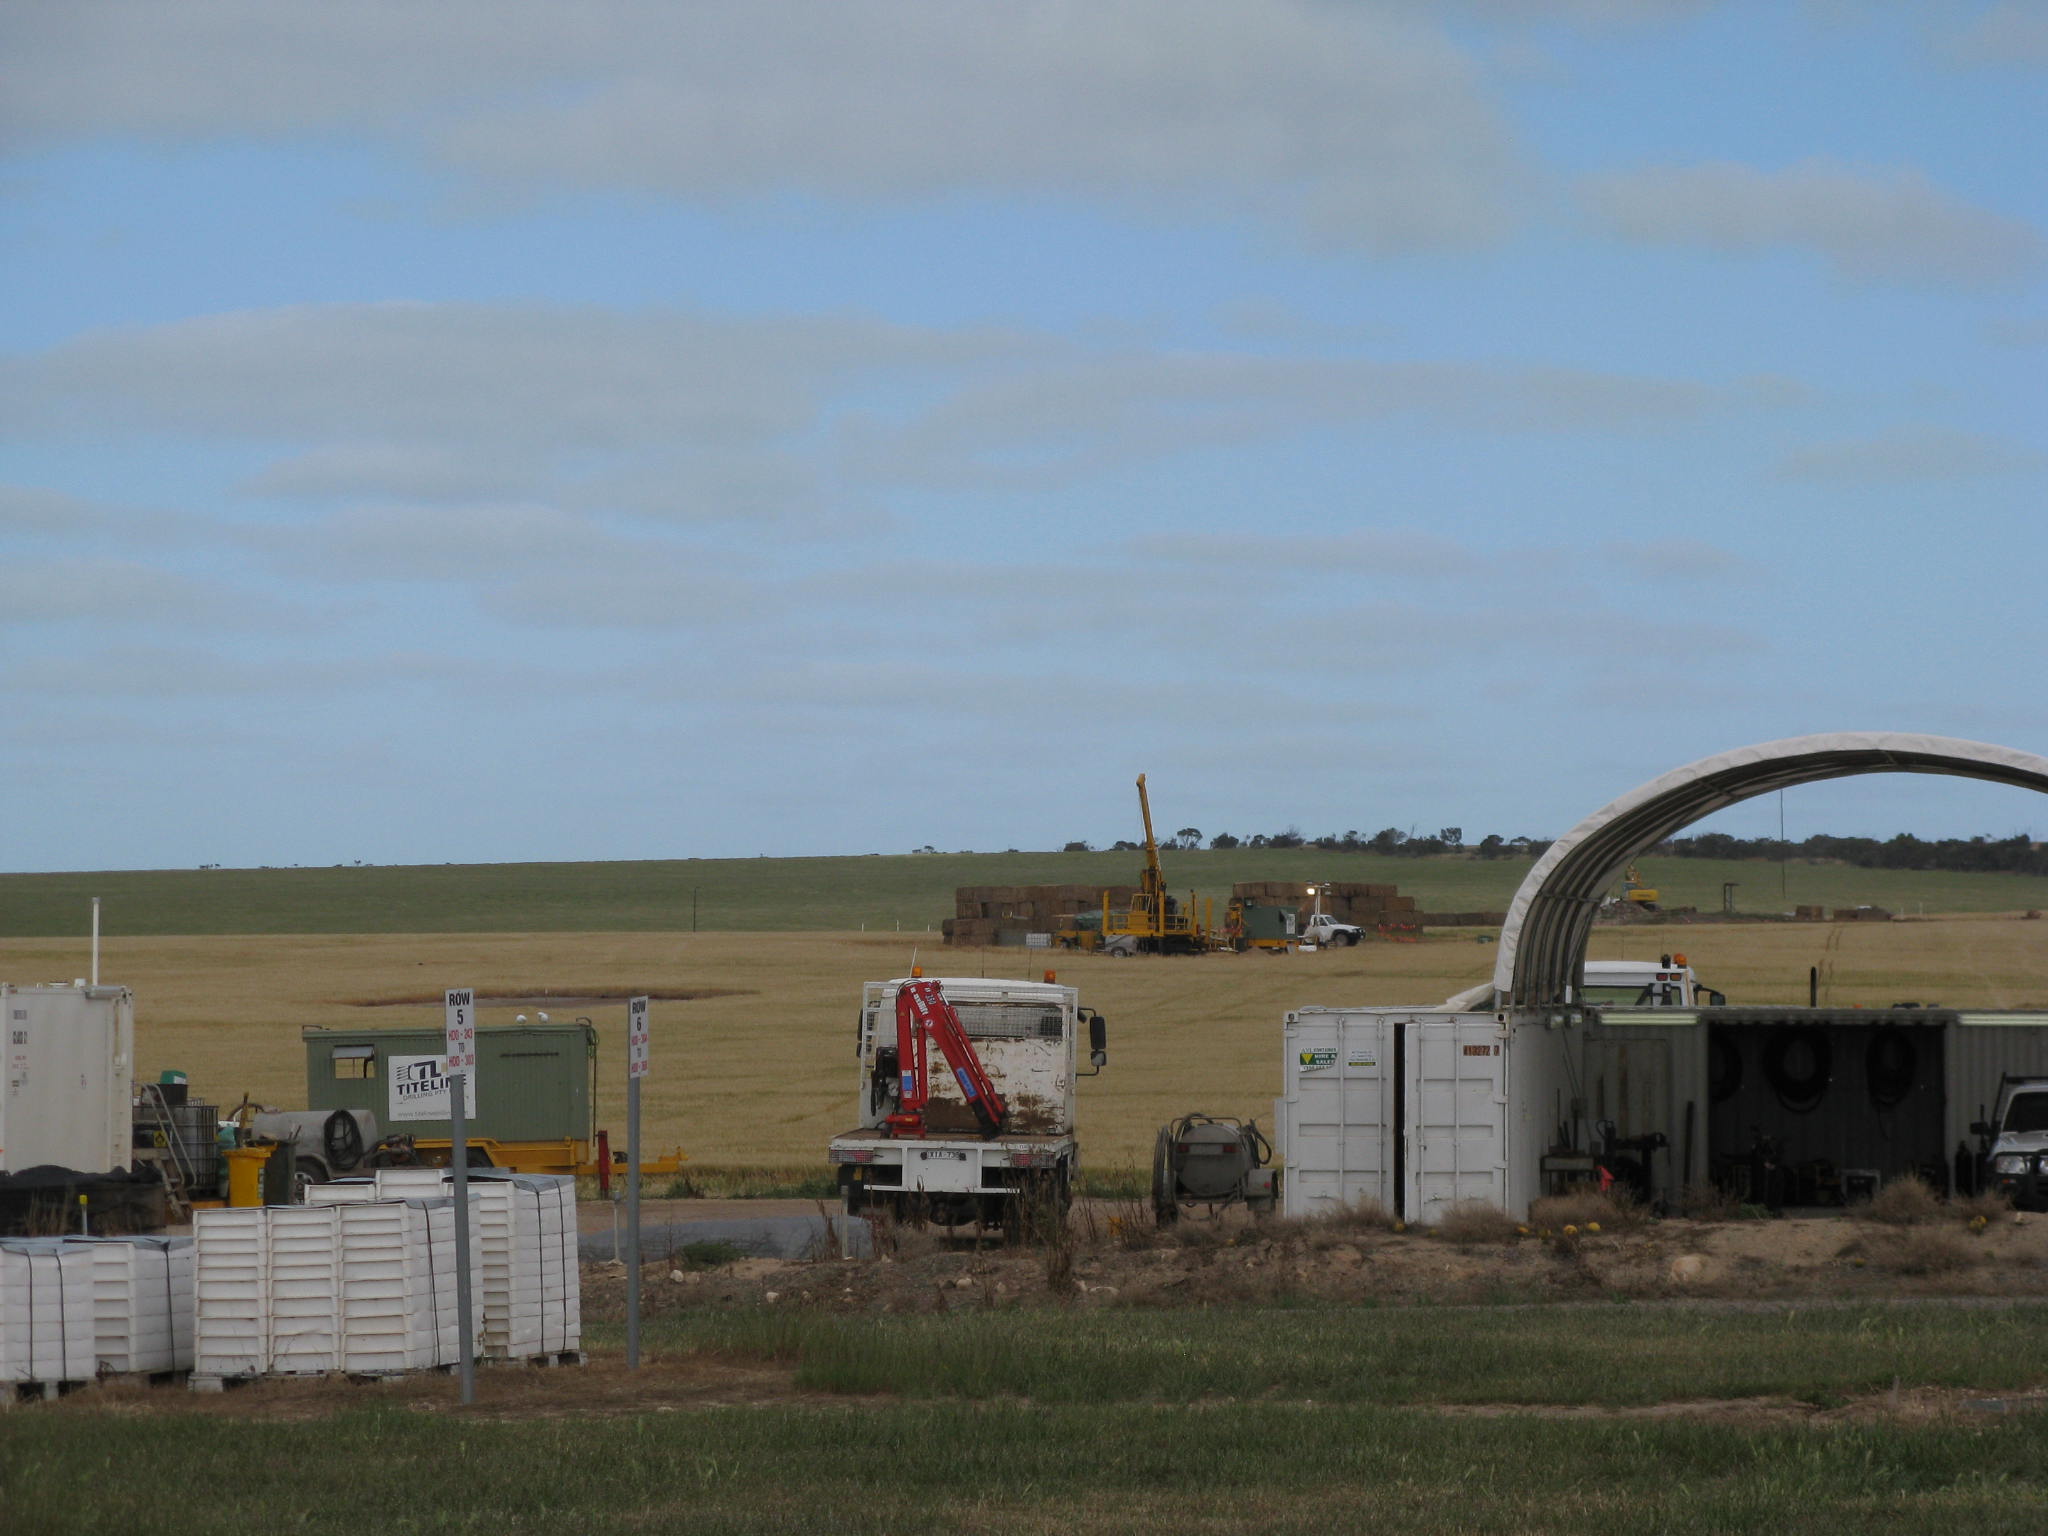
Drilling on the Hillside IOCG deposit on the Stuart Shelf of South Australia about 70km from Adelaide. This blind deposit (330MT at 0.6% Cu, 0.1 g/t Au & 13.7% Fe) was discovered by junior explorer Rex Minerals in 2008 as a result of targeted conceptual exploration.
Most exploration programmes employ elements of both conceptual and empirical approaches and their exploration curves lie somewhere between the two end member curves shown on the figure.
[1] And much good did it do WMC. In the end, they were still taken over by BHP Billiton. However, the geologists involved – Roy Woodall, Doug Haines and Tim O’Driscoll gained hero status and well-earned bragging rights.
[2] Iron Oxide Copper Gold.
[3] Greenfield exploration is where there are no pre-existing mines or prospects. This contrasts with brownfield exploration, which is conducted in the vicinity of existing mines.