![]()
Diamond drilling of a prospect typically goes through two phases. The required geological inputs for the two phases are different.
The first phase comprises initial exploration drilling ‑ the target generation and target drilling exploration stages. In these stages drilling is aimed primarily at a geological understanding of the prospect and a qualitative assessment of the potential for ore. This is the most critical stage of prospect drilling. The geological logging process is often difficult ‑ unfamiliar rocks are being encountered and it is hard to know which of the almost infinite number of observable core features are significant, can be correlated between holes and are critical to understanding the mineralization. Yet if the mineralization is not understood an ore body might be missed. The geological returns gained from the first few drill holes into any prospect therefore need to be maximized, and observation and recording should be as detailed as can be achieved. As a general guide, a geologist should not expect to average more than 5 m of core logging per hour when logging mineralized rock, and she should be prepared to pick up and examine every surface of every piece of core.
The second phase of drilling is undertaken after it is determined that there is a good probability that an ore body is present. This is resource evaluation and definition drilling and is largely aimed at establishing economic (such as grade and tonnes) and engineering parameters. If a project gets as far as this stage (and the majority will not), the main geological questions should have been answered and the geologist will have passed the steep part of the learning curve. With resource evaluation drilling, there is normally an increase in the meterage of core being produced and the logging requirement is now for the speedy and accurate collection and recording of large volumes of standardized data.
The way data are to be recorded influences in a significant way the amount and type of data that are observed. The “medium is the message”, as Marshall McCluhan famously pointed out in 1964. Using the most appropriate system for recording geological observations of drill core is therefore very important. Although a huge number of different logging forms are used in industry (almost every exploration group has its own design), there are only three basic methods for recording observations on drill core and cuttings. All individual logging systems correspond to one or other, or a combination, of these basic methodologies. The three logging styles are characterized here as prose logging, analytical spread‑sheet logging and graphical scale logging. They are described below:
Prose logging
Almost nobody uses this type of logging nowadays (and a good thing too). But up to about 30 years ago, almost nobody logged any other way, so you could well come across examples when researching historical core logs.
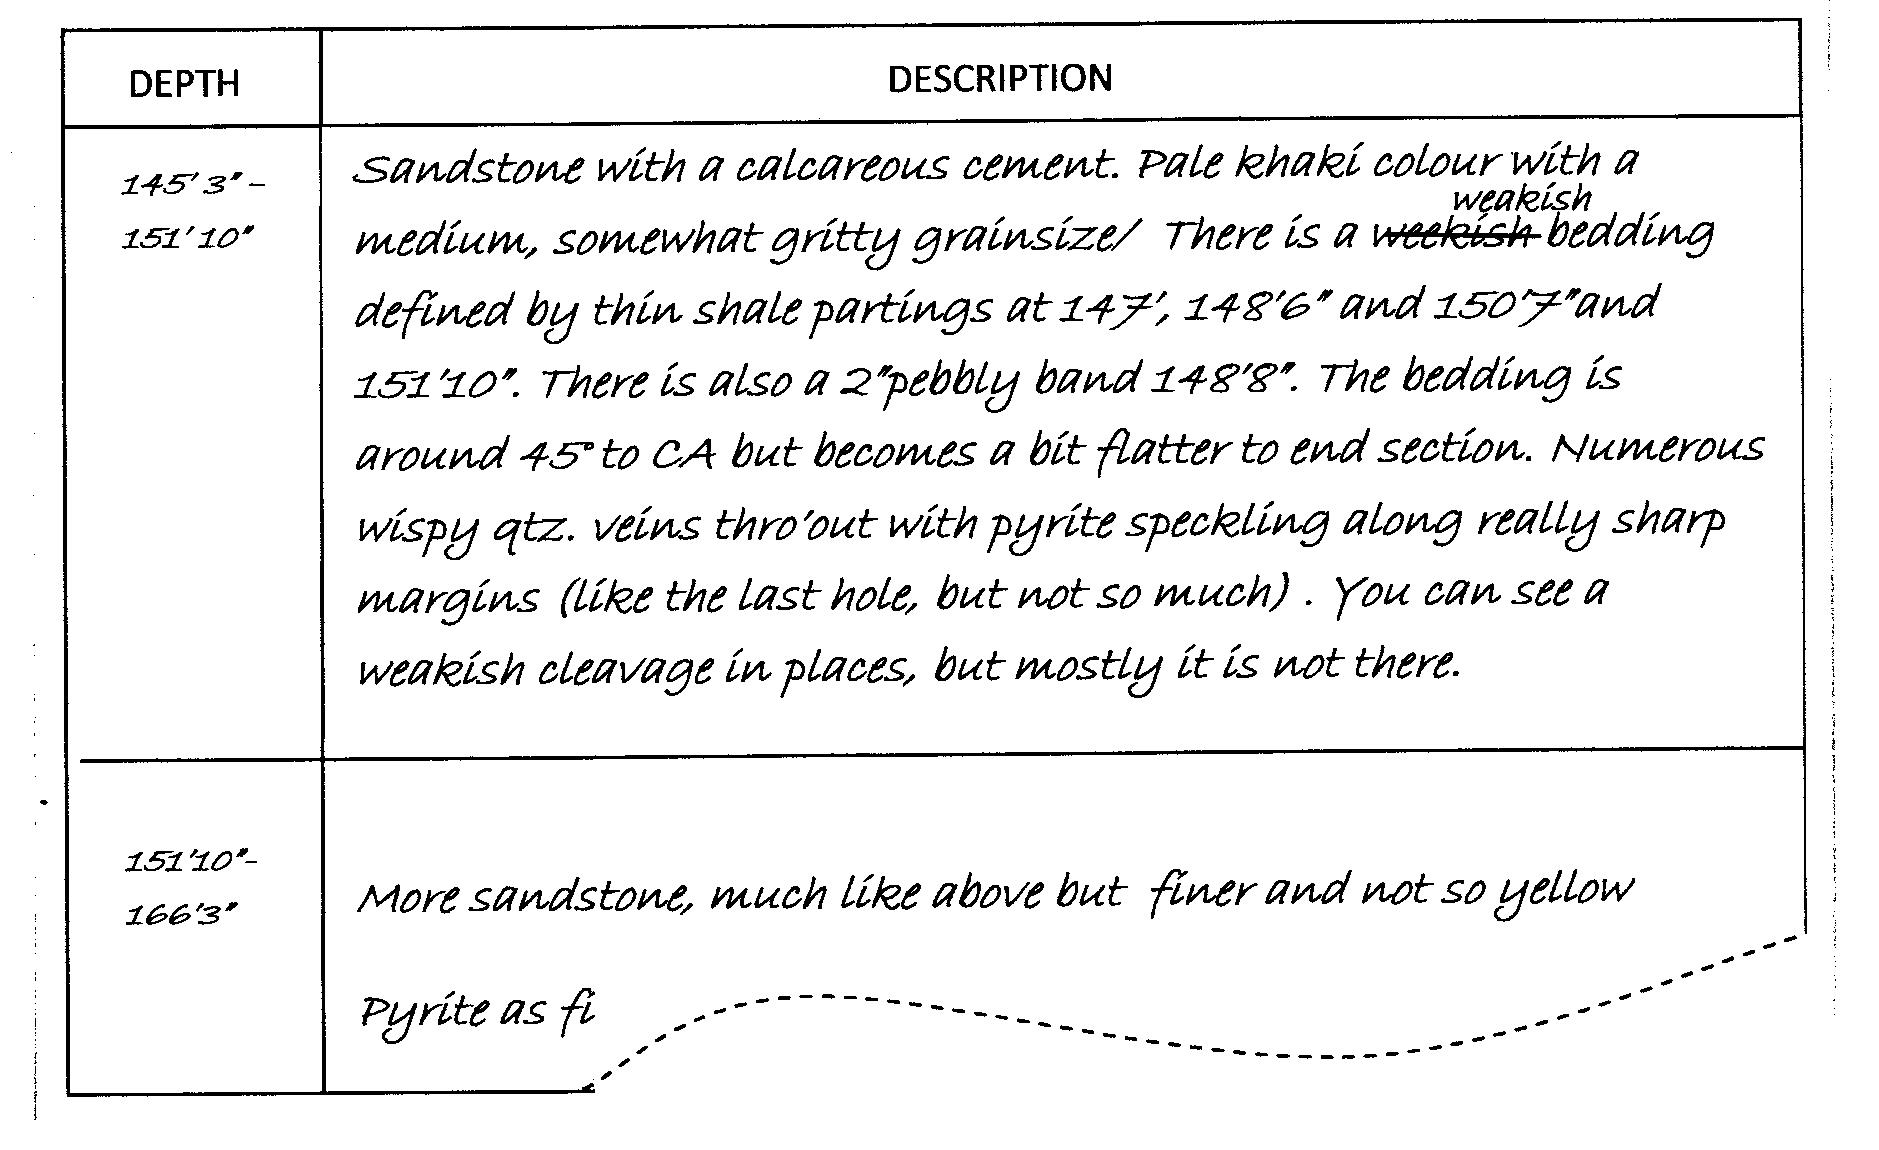
In prose logging, an interval is selected, identified by its down-hole depth limits, and then described in words. Such a log will look like the example below.![]()
![]()
![]()
![]() An example of the prose style of recording geological observations of core or cuttings. An interval is selected, defined by precise down-hole depth intervals, and then described in words. It is difficult to extract precise, objective information from such logs and they are usually tedious to read. The style is not recommended even if your handwriting is as legible as this, which it almost never is.
An example of the prose style of recording geological observations of core or cuttings. An interval is selected, defined by precise down-hole depth intervals, and then described in words. It is difficult to extract precise, objective information from such logs and they are usually tedious to read. The style is not recommended even if your handwriting is as legible as this, which it almost never is.
Words are a powerful means of summarizing conclusions. Prose is an invaluable way to present an argument, give an explanation or provide a discussion. However, long passages of prose are a laborious and ineffective way of recording the complex spatial relationships that can exist between the observable features of a rock. It is also unlikely that any two geologists would ever describe a rock using quite the same words. This means that extracting precise and objective information from a prose log, so as to construct a drill section or to understand the relationships seen, is difficult and time consuming.
This type of logging no doubt serves as an effective aide memoire for the geologist who compiles the log, but for anyone else it can be a pain to use. As a general rule, literary efforts should be reserved for report writing and not as a means of routine core description. This style of logging be only used, if at all, in a special “Comments” column to provide brief verbal commentaries to complement one of the other two logging styles.
Graphical Scale Logging
Initial stage drilling needs to make use of a logging system that permits and encourages detailed observation and presents the information in a manner that aids interpretation. Pre-eminently, the best recording system for this is graphical scale logging. In such logs, a down-hole strip map is made of the core at some chosen scale, say 1:100. Structures are simply drawn onto the map in the attitude that they appear in the core. For example a 50 cm vein, which cuts the core at 45°, will be drawn (at 1:100 scale) on the core map as a 5mm wide vein at 45° to the core trace. Different columns of the pictorial log (think of them as different specialised maps) can be allocated for different features of the core: for example there could be separate maps (columns) for lithology, alteration, veining and structure. An example of this type of logging is shown in the figure below. All the columns are linked horizontally on the log by being drawn to a common vertical down page (down hole) scale. When using such a log, it is easy to give different features different down hole depth ranges something which is almost impossible to do in other types of logging. Another unique advantage of the logging system is that gradational geological boundaries can be shown in a simple graphical manner. Illustrations of graphical techniques that can be used in this type of logging are shown in the figure below, taken from the log of a DD hole targeting mesothermal gold-bearing quartz veins cutting Proterozoic metasediments in the Northern Territory of Australia. The log sheet used has a background of 2mm squared graph paper (hopefully the fine blue background lines are visible on your image) to facilitate drafting to scale chosen. In this example the scale is 1:100 or 1cm = 1 meter, down-page.
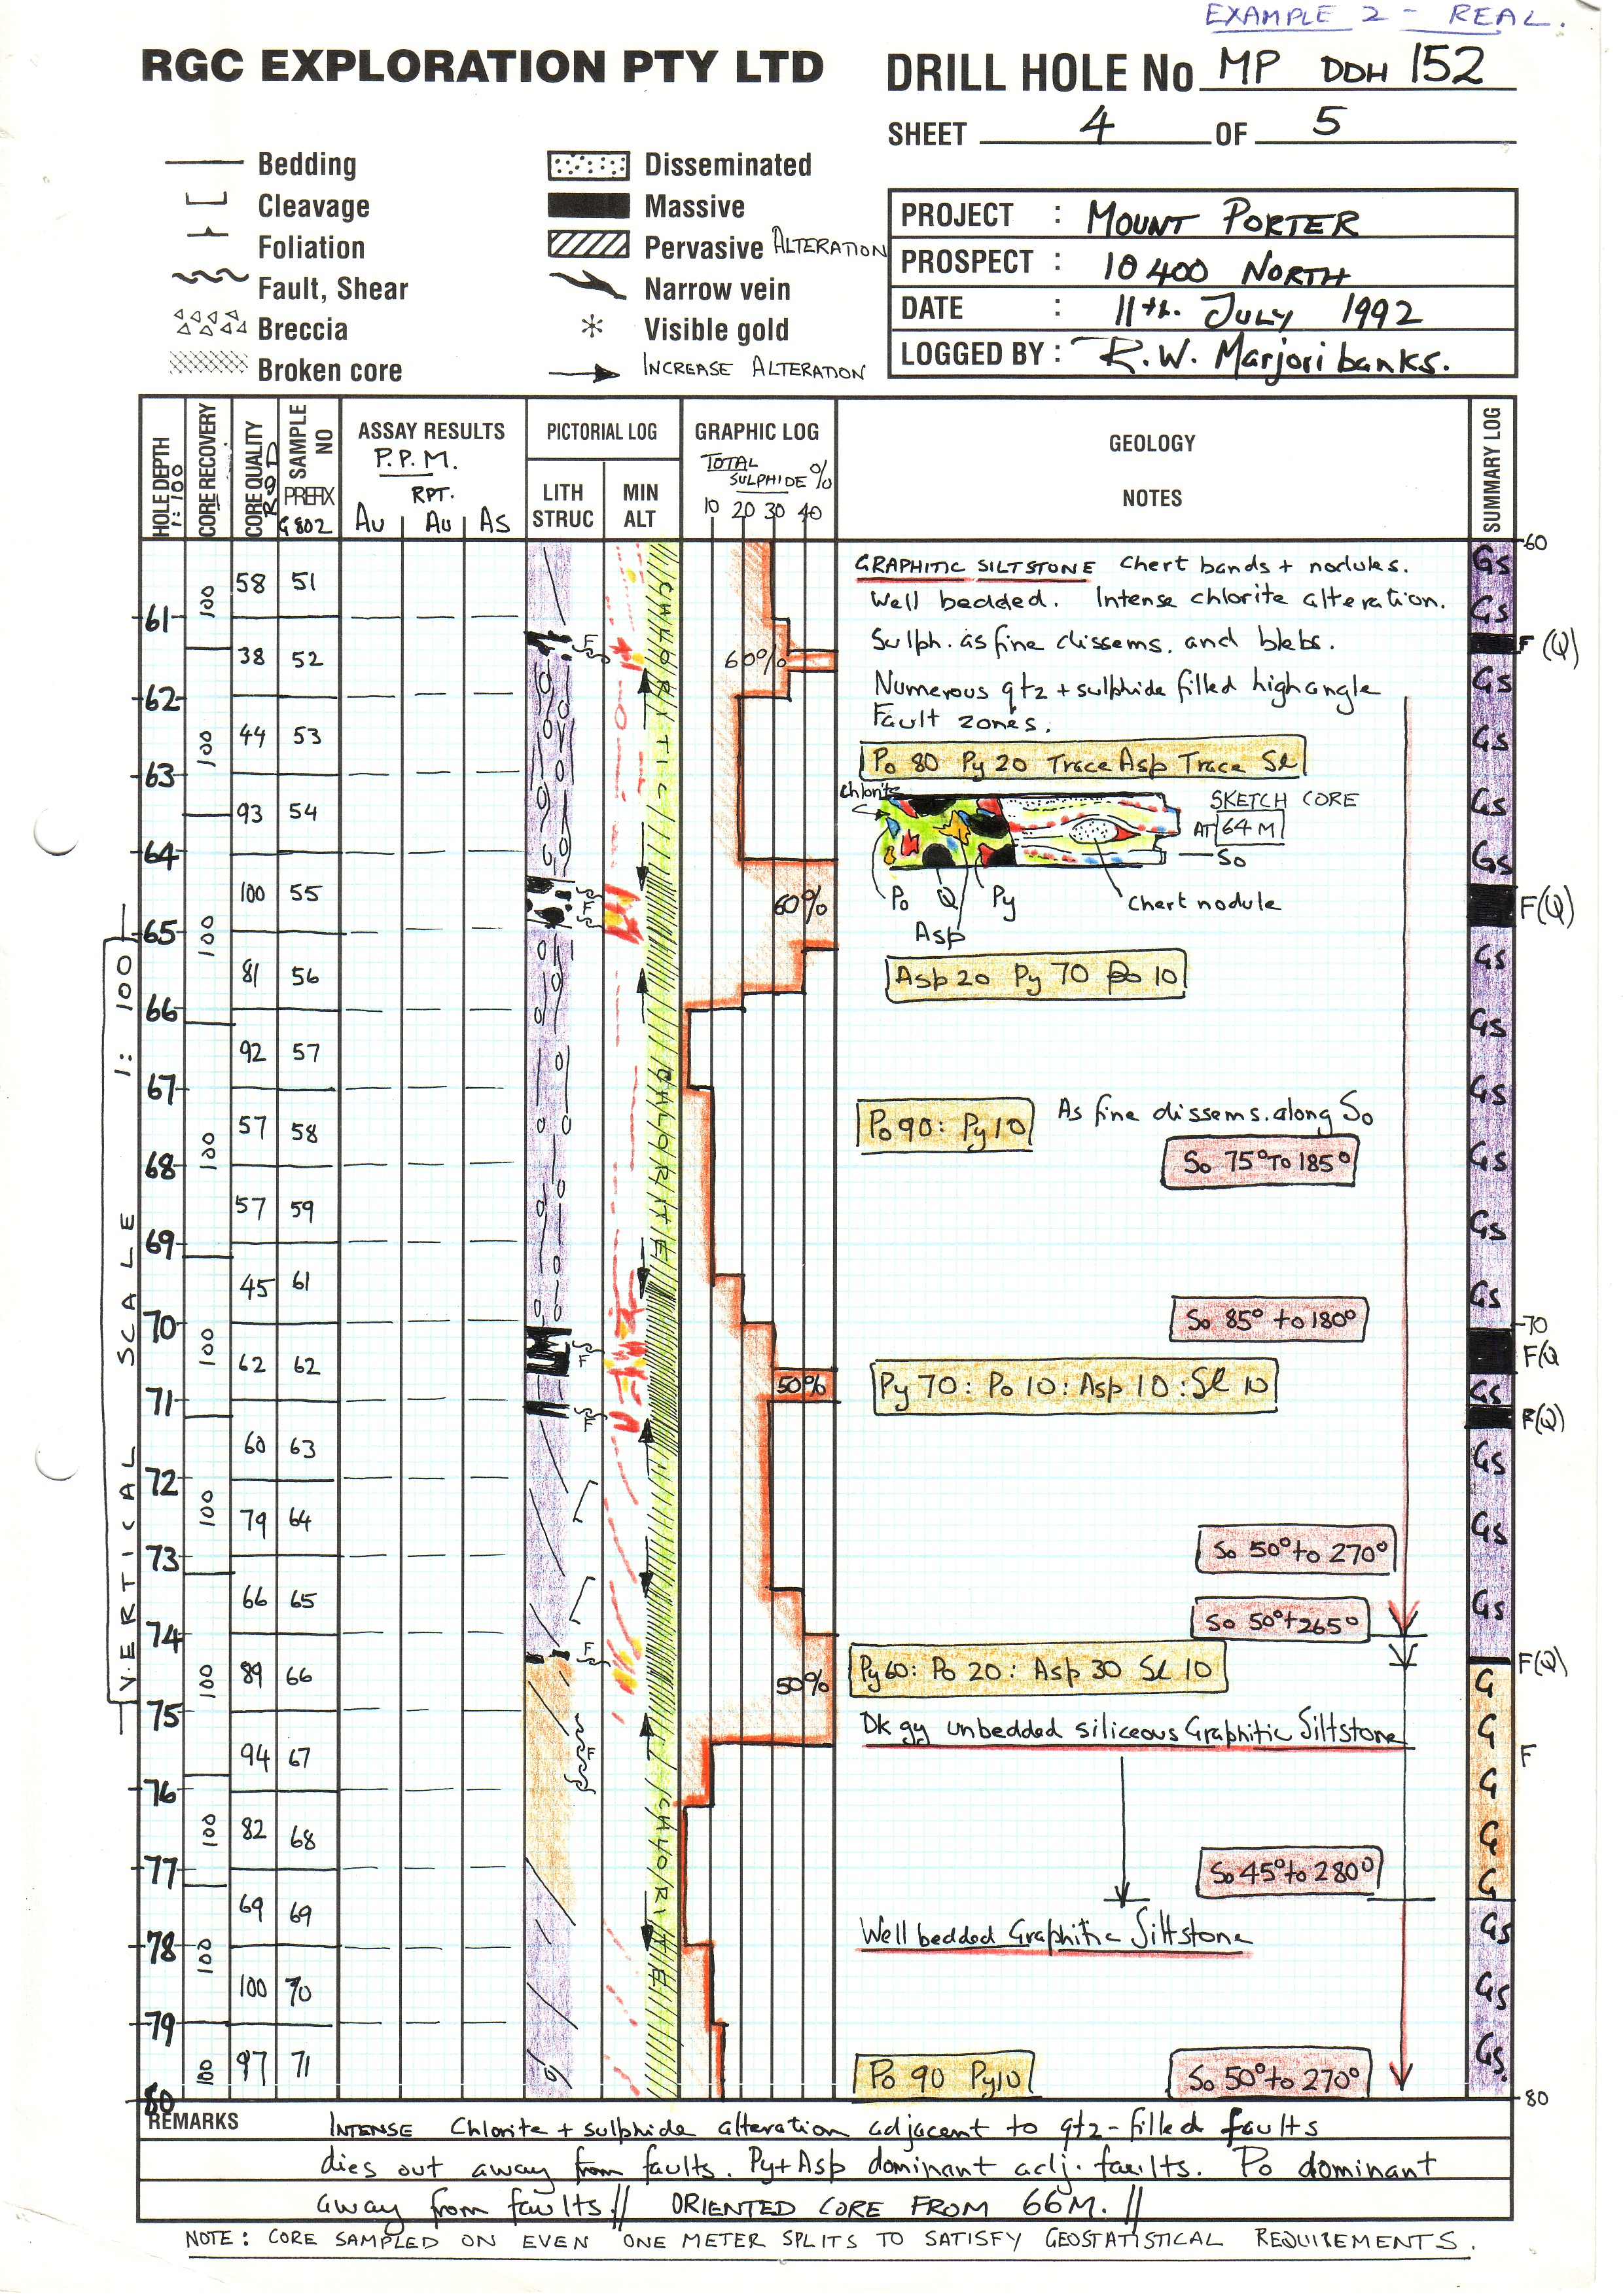 An example of diamond drill core logged using the graphical scale method. Observations are recorded graphically and numerically on the log sheet against a selected down-page scale. The use of colour on such logs greatly enhances information content. Graphical logging is a powerful and flexible technique which supports detailed observation: its use is recommended for all first stage exploration drilling.
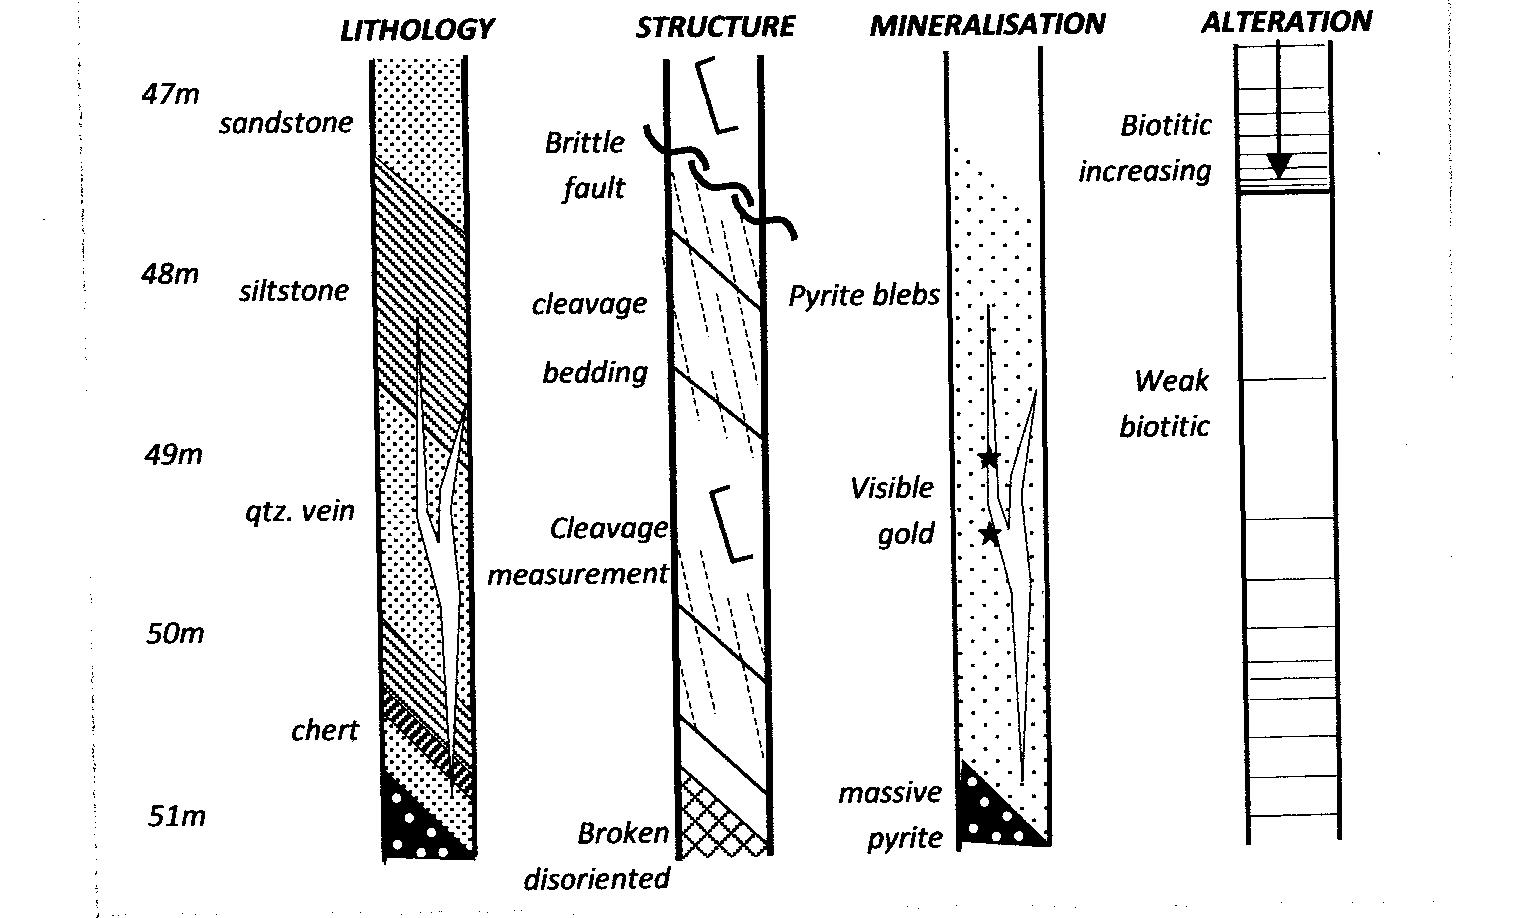
An example of graphical scale logging (tailored for use in showing grain size variations when logging volcanic sequences) can be found in the excellent book “Volcanic Textures” by Jocelyn McPhie[1] (pages 18, 19). Other examples of the type of symbols and conventions that can be used in graphical logging are shown below:
![]()
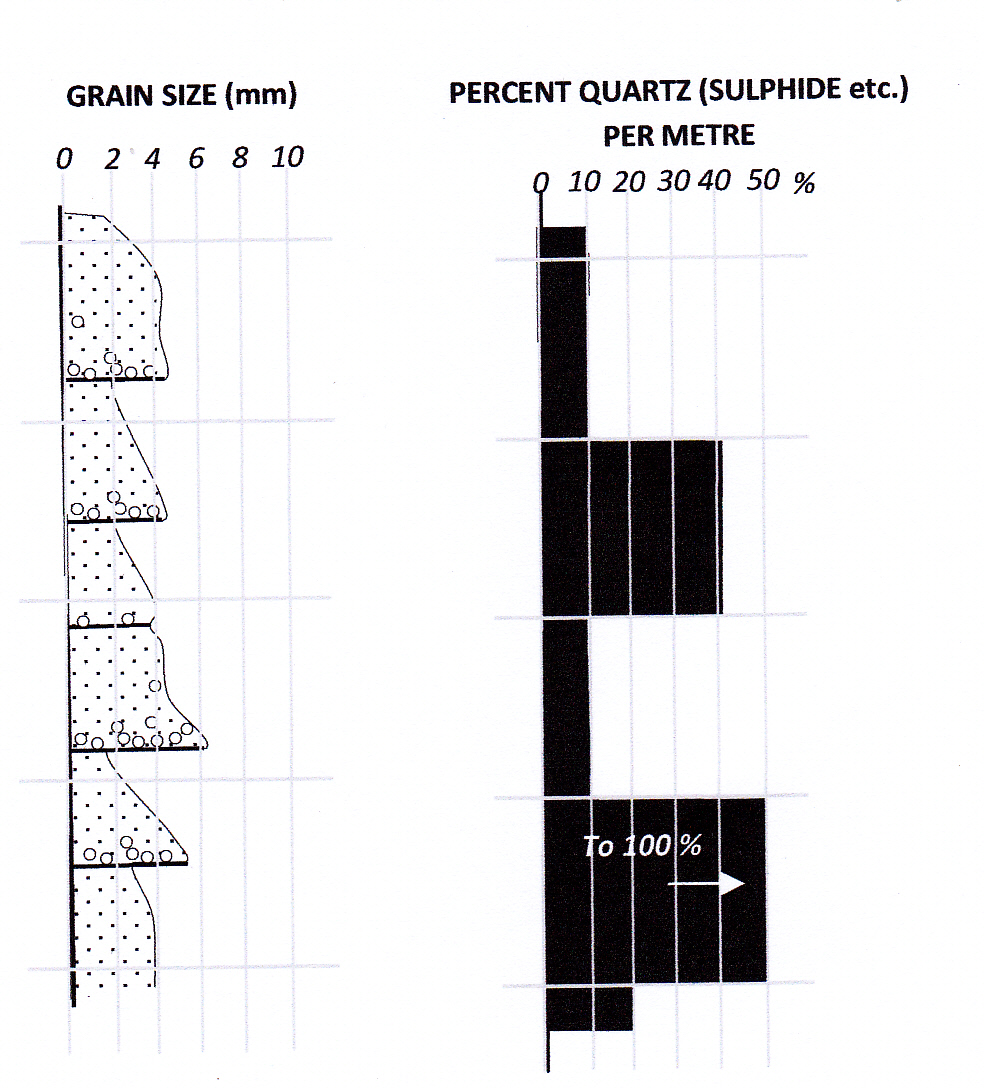
Examples of symbols that can be used in graphical scale logging.
The scale chosen for graphical logs determines the amount of detail that can be shown. The 1:100 scale of my example is a good general scale and will suit most drill holes; it enables 20 meters of core to be mapped and described on an A4 size log sheet. However, through areas of structural, mineralisation or alteration complexity it may be necessary to log a larger scale of 1:50 or even 1:10. For first pass logging of a hole prior to a more detailed subsequent log, a scale of 1:250 is useful. It is good practise to log the entire hole at a general scale such as 1:250 or 1:100 before returning to log individual section of interest at a larger scale. A comparison would be a general regional geological map that is followed up by more detailed outcrop maps of smaller areas that are of particular interest.
Obviously, not all observations or measurements that can be made on core can be shown graphically, so a graphical-scale log sheet will also need to provide extra columns for recording digital data or for making verbal annotation, description or comment of the rock or structure. In other words, a good graphical log sheet should be complemented with extra columns which feature the strengths of both the prose and analytical styles of logging.
Data relating to the frequency of some core feature (for example: number of fractures per metre; percent vein quartz per meter; percent sulphide per meter etc..) can be shown as a down hole histogram.
If the core is oriented, individual structural measurements are recorded directly as strike/dip/dip direction onto a column of the form. If the core is not oriented, alpha angles can be shown graphically (analogue recording) in the mapping column, but can also be recorded digitally in a separate column[2]. Important details of structures or structural relationships that are too small to be shown on the core maps, can be sketched into an unspecified, or “Comments” column.
Geological logs using graphical scale methods are analogue logs. They can be scanned for computer storage but are not capable of being analysed, searched or plotted as graphs or sections by computer. Such logs have to analysed, searched and plotted on sections by hand to achieve their maximum benefit as a tool for understanding the geology of the prospect. However, hand plotting of geological sections is the recommended procedure in the early stages of drilling into a new prospect. However, graphical scale log sheets should provide a column where a simple summary log of principal lithologies for the hole are shown, using a symbolic or numerical code. This will facilitate manual entry into a searchable and plottable computer data base.
Graphical scale log forms, with several mapping columns along with extra columns for recording digital data, sketches, verbal comment etc. can be as varied as the number of prospects that are being drilled. However, the important feature about all such logs is that they assemble many different types of geological observation that are linked by a single down page scale. All important relationships, but especially spatial relationships, can thus be seen at a glance. Graphical scale logs such as described above are a powerful tool in helping to understand geology and to correlate structures between holes. However, there is no doubt that such logs are slow, even tedious, to prepare, and are unsuitable for the intense drilling programs of more advanced prospect exploration. Once an understanding of the geology of a prospect has been gained (this may be after the first 1-2 holes or after the first 10-20 holes, depending on the complexity of the geology and the quality of the initial geological input), a simplified, more focussed and objective, logging process is appropriate.
That system is analytical spread sheet logging.
Analytical Spreadsheet Logging
Use of spread‑sheet logging is indicated in second-phase drilling programmes (resource evaluation and definition) where the main geological problems associated with the ore body have been solved, and the aim of the logging is the routine recording of masses of reproducible data. It is also an ideal technique for recording geological data obtained from rotary percussion (RAB and RC) drill cuttings. In these holes, observations already come pre-divided into 1-3m slices, the range of possible geological observation is limited and no quantitative structural data is possible.
In analytical spread‑sheet logging[3], the characteristics of the rock are described under a number of precise, prior-defined categories such as colour, grain size, mineral content, number and type of veins, type of alteration, intensity of alteration etc… For descriptive purposes the rock is thus reduced (analysed) to its individual components. These descriptive parameters form the headings for the columns of a spreadsheet. The rock is then described under selected depth intervals that form the rows of the sheet. To keep the log compact and precise, symbols, standard abbreviations and numbers (geocoding) are used whenever possible to record this information.
An analytical spread sheet log will look something like the example below. This is a simplified example: an actual log would in most cases provide many more columns allowing greater detail of description.
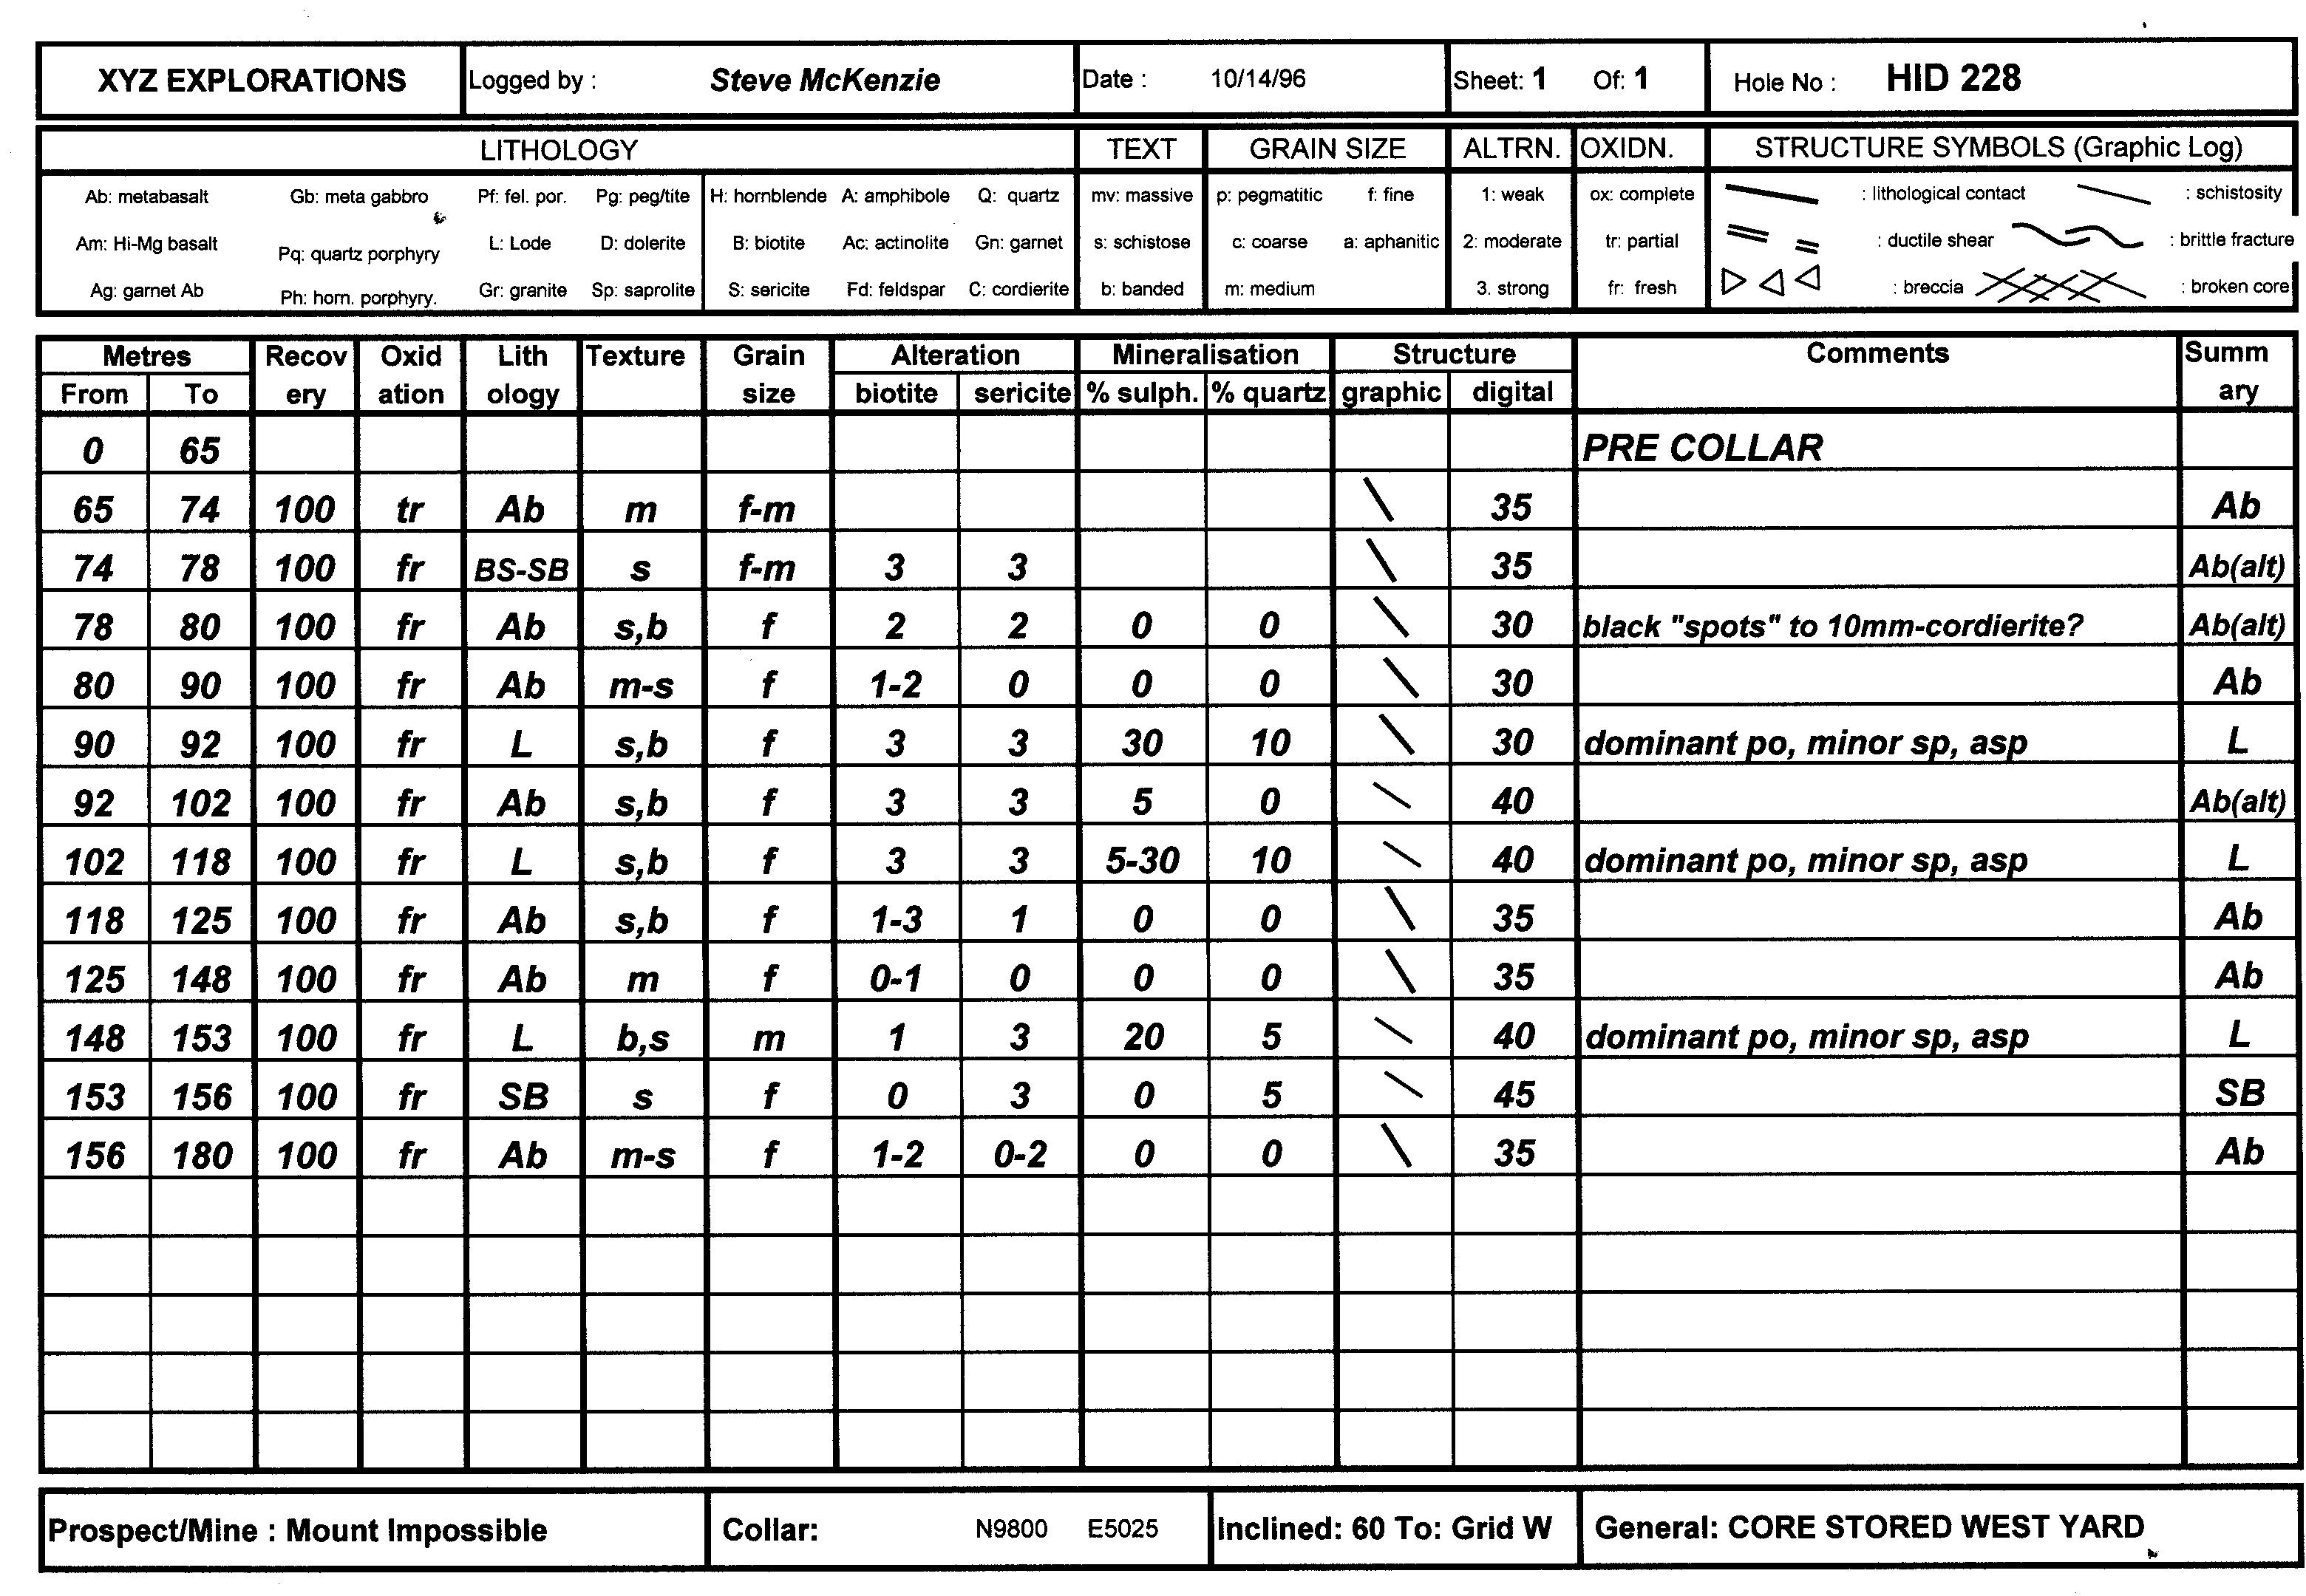
A simple example of the analytical spread sheet logging style. Observations of core or cuttings are broken down (analysed) into a number of objective pre-defined categories (the columns). Selected down-hole depth intervals (the rows) are then described under these categories. Numbers, abbreviations and symbols, according to a pre-defined geocoding system, are used wherever possible. The log aims to provide objective, reproducible and easy-to-access information that is suitable for direct entry into a computer. Information in the database can be readily searched, analysed and displayed by a suitable software program. The system is ideal for logging rotary percussion drill holes, for mine drilling and for the advanced definition drilling stages of an exploration programme.
The great strength of this style of logging is that it precisely defines the type of data to be recorded and presents them in a standardized and easily accessible format. All geologists logging the same section of core should produce much the same log. In addition, the spread‑sheet log is ideal for direct computer entry of data as observations are made, and it is compatible with electronic data storage and geological presentation software.
With this logging system it is possible to speed up data entry using a bar code reader. All the possible observations which can be made in each column of the log are printed out in advance, along with a bar code. If these pages (usually laminated) are kept to hand during logging, a simple swipe of a barcode reader can then instantly enter data into a portable notebook or palm‑top computer. Bar code entry is of great value when logging rotary percussion drill holes where rapid logging is often required.
In spite of these advantages, the problems associated with spread‑sheet logs can be extreme. They set limits to the range of possible observations that can be made. There is an obvious danger inherent in defining the categories of observation, and the range of variability within each category, before logging takes place. It imposes sharp boundaries on continuous variables. It imposes artificial certainty on fuzzy observation. A confirmation bias is pre-determined and built into the system by the designer of the log sheet. Even more importantly, such a format provides no way to record the spatial relationships between the different categories of observation other than by the crude technique of specifying a down hole depth range. The horizontal rows on the log sheet only allow for definition of observed characteristics between precise depth limits whereas, in reality, many features in a rock will vary in a gradual way, and different features that need to be described may vary at different rates, or have different down-hole depth ranges.
On spreadsheet log forms, structural observations are usually recorded by a standard symbol for the nature or age of the structure (for example: S0, V1, F2 etc. – representing respectively: bedding Surface, 1st generation Vein, 2nd generation Fold etc.). The structure symbol is combined with a column or columns where the measured internal core angles for the structure (alpha and beta – see my other Blog Posts in this Drilling Category) are digitally recorded. Most analytical spreadsheet log forms will also provide an unstructured “Comments” column, where verbal annotation, qualification or comment about the structure can be added.
[1]Volcanic Textures, J McPhie, M Doyle & R Allen, 1993. CODES, Univ Tasmania
[2]For further comments on measuring structures in oriented core see my other posts under “Drilling”
[3] This type of logging has been referred to as fixed format logging using alpha‑numeric codes. The term used here is considered to better reflect the methodology behind this system.