Explorers for minerals work with maps. The scale of the map controls the detail of the information that can be shown. With geological, geophysical or geochemical information, State Surveys , typically, present their data at regional scales ranging from 1:250,000 down to 1:50,000 : these aim to show the boundaries of major rock formations and faults of regional significance. However, Explorers are not that much interested in strato-tectonic units except as part of their strategy for large area selection: they want to find Prospects that they can drill holes into as quickly as possible. Regional maps are of little value for that.
In mature exploration camps, literature search or prospecting activity enables companies to go direct to Prospect exploration – a process generally referred to as Brownfields Exploration. This is generally only possible in well-known exploration terrains. Elsewhere, and particularly in third world countries, companies have to carry out exploration to bridge the gap between the publically-available regional-scale data and the detailed scales at which Prospects are evaluated. This is known as Greenfields Exploration and usually involves acquiring and compiling data at semi-detailed regional scales.
What is the best scale to carry this out?
I received the following email query on this subject:
I’m a junior geologist with ……Mining Limited. I recently graduated with a BSc majoring in Geology in 2013 from the University of ……. I have a copy of your “Geological Methods in Mineral Exploration and Mining” by Springer. I’m relatively new to Exploration and currently assigned to the Regional Exploration team as part of my training. I am currently trying to compile data for field work and I’m wondering if you could give me some tips on how to go about doing it.
· What types of map should I have and appropriate scale
· What data to put on the map and which data go well together on a map especially for regional work (eg: geology + drainage, topo + geochem, topo + geophysics or everything together in a map?). The main idea is to have the map presentable and appropriate for field work.
B.
Here is my reply:
. Your queries on map scales and data for regional exploration are all important and relevant ones. If you have a copy of my book you will probably find answers to many of your questions there. For example, the chapter on mapping includes a discussion on the appropriate scales for different types of exploration (C 2.1.5). The Chapter on GIS (C 10) has some discussion on combining different types digital map data relevant to exploration.
For regional exploration the scale at which to work depends on the size of the target sought, the size of your tenement holdings, the nature of the terrain, the extent of existing knowledge and the maps that are actually available to provide a base for assembling your observations. So there are no simple answers to your questions. However, regional exploration is carried out at a scale that is more detailed than typical Geological Survey maps (i.e. larger than 1:100,000) and less detailed than typical prospect maps (1:1000 to 1:5000). 10,000-20,000 scale is often ideal. The scale chosen needs to be such that the lithological and structural features that might characterize the immediate environment of an economic ore deposit (the mineral system) can be easily shown.
The best base for everything (geology, structure, geophysics, geochemistry etc.) is satellite imagery, particularly that from VHR (very high resolution) platforms offering 2.5m pixel resolution or better[1] . Such images can be viewed at 1:10,000 scale (see footnote). For general geology/structural interpretation you should use images of reflectance bands in the visible spectrum (known as false colour composites) with mid-morning illumination. Such images are readily available (even Google Earth is sometimes acceptable) but the problem in tropical areas is always that of getting acceptable cloud-free images. You will need to use a specialist provider such as GEOIMAGE to do a search of their extensive back catalogues.
For desk-top-based geology and structure interpretation, air photos have an important role (often now neglected). Good quality 25,000 scale stereo photos are often available from National archives and are cheap and readily available (at least they used to be when I last worked in your country). The advantage of stereo air photos over satellite images is that they have a vertical resolution that is at least an order of magnitude better than the satellite product – critical for structural interpretation.
Combining different geographically-referenced digital exploration data sets is best done on computer using GIS software. Combine anything you like as different layers on your monitor until you get something that has relevance for you to the questions you want to ask of the data. Combining more than two data sets at once generally leads to visual chaos unless you carefully select and edit the data sub-sets that you wish to appear. Try different enhancement techniques – illumination angles, edge enhancements, restriction of data to different intensity bands, different colour schemes, colour intensity etc.. This may not always work, but is always good fun. Then print out a hard copy. Get some coloured omnichrome pencils or textas and draw your ideas/interpretations on the paper image, trying to pull out meaningful patterns.
There is no magic combination. Just play around and see what works.
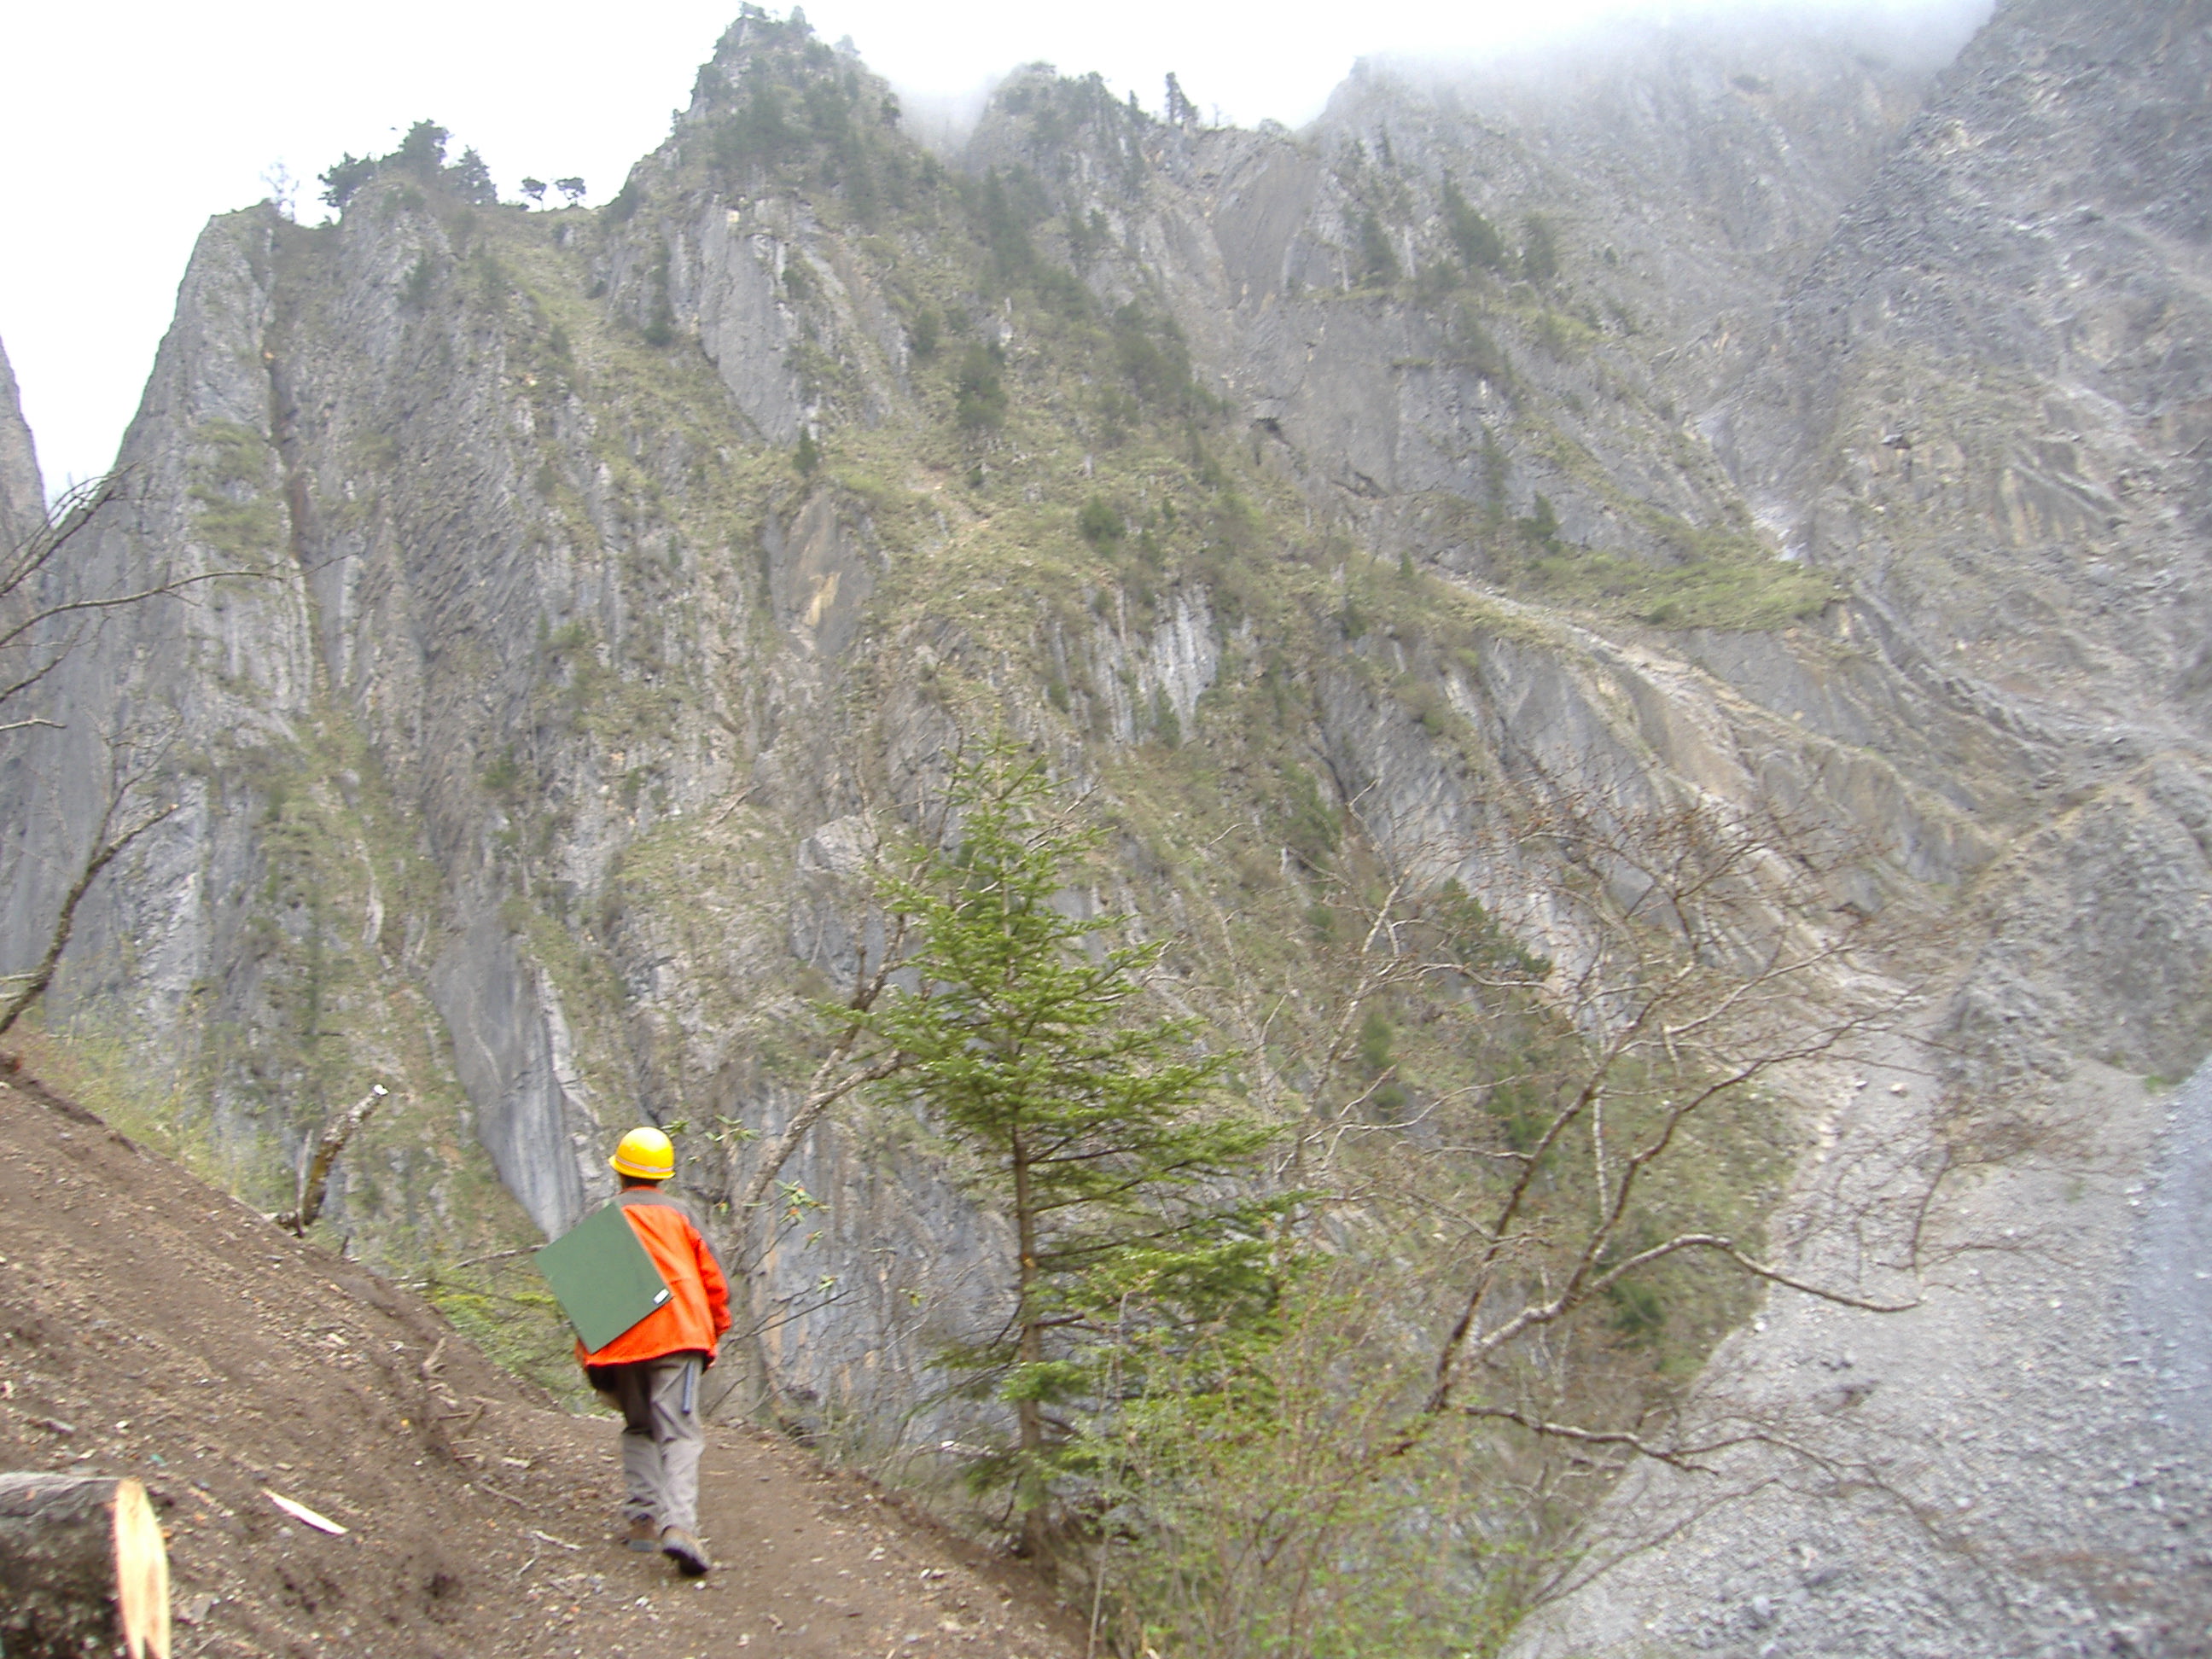
Minaral exploration geologist undertaking detailed regional mapping with map-board over shoulder. Sichuan Province, China
For field work your need is primarily for maps that you can locate your position on and use as a paper base to record your field observations. A detailed topographic map with drainages, contours and cultural features at around 10,000 scale or better, is ideal. This is not always available but VHR satellite imagery also will serve for this purpose Note that it is a bit harder to make clear annotations on a satellite image in the field, although the addition of a clear plastic overlay – as described in my book – will help here.
The map that you take into the field should not be cluttered with geophysical or geochemical data, although you can record on it in advance a few points of interest from other data sets that you want to check in the field. Above all, the field map should not show the results of someone else’s geological interpretation. It is a blank slate on which to record your own observations, which can later, back in the office, be compared with other data or other interpretations. Your field map will need to be folded or cut to fit into your map case or clip board: it will inevitably become creased, stained and dirty. At the end of every day, observational data should be transferred from the field map to a clean copy that you keep at base camp.
[1] A 2.5m pixel (i.e. data measured and composited over an area of 2.5m x 2.5m), when reduced by a factor of 10,000, on the resulting image is 0.25mm x 0.25mm. At 0.25mm we reach about the limit of resolution of the human eye. 1:10,000 scale is therefore approximately the most detailed scale at which the mass of contiguous 2.5m pixels can be shown and still retain sharp definition and smooth appearance. Any attempt to present the 2.5m image resolution at any scale significantly-higher than 1:10,000 will progressively destroy the image by making the individual pixels visible. As a general rule of thumb, multiplying pixel size by a factor of 4000 provides the optimal scale for viewing. This is called “The Rule of Four”