The concept of the anomaly is one of the most basic ideas in exploration geology. It is understood in these terms - it is a truism to say that significant metal ore bodies are unusual: another word for unusual is anomalous.: therefore, if mineral explorers (explorationists) identify anomalous aspects of the natural environment, it may indicate the presence of an ore body.
Let’s explore that idea.
In prospective areas where outcrop is poor, or that have been subject to intense mineral search over a long period of time (generally known as “mature” exploration areas), the explorationist increasingly has to make use of geophysical and geochemical methods in order to extend the search into areas of shallow cover inaccessible to more traditional prospecting. Some of these geophysical and geochemical methods also allow for rapid regional appraisal of areas where ground access may be difficult ‑ for example rain‑forest terrain or Third World countries with poor infrastructure.
Geophysical and geochemical techniques typically measure objective characteristics that are possessed by all rocks to some degree and result in the collection of large amounts of geographically referenced digital data. Explorationists undertake two different kinds of survey: those that are aimed at defining regional geology and those that aim to directly locate ore. In some cases there is an overlap between these two types.
The second type of geophysical/geochemical survey is aimed at measuring unusual or atypical features of rocks that directly reflect, and have close spatial relationships to, economic mineralization. Since ore bodies are in most cases small relative to the earth’s crust, such surveys have to be based on detailed, close-spaced measurements and are generally expensive. Ore targeting surveys would normally be undertaken after a prospect, or at least a prospective belt of limited area, has been defined. The critical step in analysing the results of ore-targeting surveys is to select those measurements that can be considered as “anomalous”. The selected anomalies are then analysed to determine the probable nature, size, position and shape of the causative body as a prelude to a follow-up detailed exploration programme, usually drilling.
But just what constitutes an “anomalous” value? How do we define an anomaly and how do we recognise it?
Defining “anomalous” is never easy. If, for example, a level of 20 ppb (parts per billion) gold in a geochemical soil survey is selected as a cut-off number to define anomalism, it would be hard to argue that there is some significant difference between that assay and one of 19 ppb which falls outside the cut-off line. And if 19 is anomalous, then what about 18? And so on. How can one apply cut-off points in what is a continuously graduated series? The same problem applies in the analysis of all numerical data sets of this type.
Here is another problem. Is the size of the anomaly (the size of the number in a measurement) a measure of its prospectivity? Bigger is not necessarily better (whether of chemical concentration, magnetism, conductivity, chargeability or whatever). Just consider this: a small number may reflect the effect of a very large source which is a long way from the point at which the measurement was taken. A large number may have come from a relatively small source which just happens to be close to the sample point. And nearness to the sample point is only one of many factors that might enhance or detract from the value of a particular measurement. For example, in geochemical surveys, assay values from samples collected at surface, while they may show the effects of primary bedrock distribution can also be expected to reflect the superimposed effects of surface weathering which can cause enhancement or depletion of critical elements by both chemical and physical processes. In geophysical surveys, measurements of magnetic, electrical or gravity fields are collected remotely. The relationship of fields measured at the instrument head to causative bedrock features is dependent upon interpretation which, however expert, is almost always subjective, qualified and non-unique.
Real data sets that provide an adequate sampling of the environment seldom possess sharp natural cut-offs: they typically have a continuous or “fuzzy”’ distribution. The science of fuzzy logic describes such systems ‑ everything is true to a degree and black and white are merely special cases in a continuous scale of grey. Fuzzy logic is the way human brains work, but is incompatible with the either/or bivalent logic of the computer. For this reason, present-day computers cannot be programmed to select all significant anomalous numbers from a data set: only a human expert can attempt that with any hope of success. The role of computer processing of geochemical and geophysical data is to present it in such a way as facilitates the human judgement process.
This problem of defining anomalous values can often be partly overcome by looking for natural groupings and patterns within the data set and making the reasonable assumption that such groupings reflect the operation of fundamental geological factors, including mineralization processes. Sometimes the natural breaks like this are apparent by simply eyeballing a print‑out of the raw data. More subtle cut‑offs in the data or breaks in their trends are often definable by graphical means or by statistical analysis. Many commercially available software programs are available which can highlight these features. These programs are powerful and useful tools that nowadays form an essential part of most analyses of geophysical and geochemical surveys. However, in my experience, if the basic signals cannot be found by eyeballing the data (once basic presentation as maps, sections or tables is carried out), then it is usually a vain hope to expect that statistical processing will make things much clearer.
In spite of such naturally occurring patterns, if a data set represents an adequate sampling of an area, then any realistic first stage analysis will almost always divide it into three basic groups.
In the first group – almost invariably the largest one ‑ are those measurements that are definitely not anomalous. These are known as background values and they can be safely ignored, at least as far as the results of that survey are concerned. In the second group ‑ probably a rather small one, if it exists at all ‑ are those measurements that are so different from the background that they cannot be ignored and demand to be explained in some way. Such numbers are so outside the mean for that domain that they will generally be confidently labelled as anomalous. The third group is a widely defined category that can be given the distinctly “fuzzy” label of “possibles”. It comprises all the remaining measurements that do not fit into the first two categories. They are those numbers that are slightly above, or at the upper limit of, background values but could be readily explained by non-mineralizing processes. They could, however, equally well be subtle expressions of ore. Since there will probably be insufficient time and money to exhaustively test all of the measurements of this third “possibles” group, a decision on which ones to follow up must be made based on knowledge gained from outside of that particular survey. This may be results from other types of geophysical or geochemical survey or knowledge of the geology and mineralization of the area. The input of an experienced explorationist is required at this point and no software program can make the decision for her.
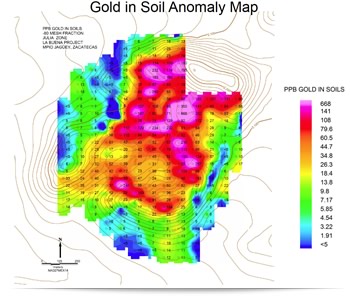
If your geochemical anomaly is as distinctive as this one, then there is little problem. Few anomalies are as distinct. Image of colour-contoured gold in soils (ppb) Separator Fault, Carlin Trend Nevada. Image from Altan Nevada Minerals Ltd : www.altnav.com
This is the main reason why no exploration technique should be conducted in isolation. The most powerful exploration programme is the one that combines data gathered from several different appropriate geological, geophysical and geochemical surveys. Ultimately, once all processing and presentation steps have been performed, the key to interpreting the results of geophysical and geochemical surveys is an understanding of the geology and ore forming processes of the area.
This takes judgement and your judgement could be wrong. But having made your decision, go back and test your “anomalies” with all the further tests that time and money allow. If you can learn from each failure, knowledge and understanding will increase.