(Updated March 2026)
A glimpse of the Future
There is good evidence that the next advance of the earth’s glaciers will occur within the next thousand years or so. A catastrophe for humanity, but I am optimistic enough to suppose that as a species we will survive. Our few remaining short-lived descendants, as they shiver before fires at the mouths of their caves will tell each other stories of a legendary past when their long-lived ancestors enjoyed a life of abundance in a former golden age – the Happy Holocene.
Meanwhile, back in the Holocene…
Today our technology is so advanced that more than 60% of its 8 billion plus citizens are free to pursue fields of skill and knowledge that have nothing directly to do with food production. In developed, industrialised nations, that percentage must be nearer 90%.
One of these fields of knowledge is geology.
The International Union of Geological Sciences (IUGS), founded in 1961, is the peak governing body of geology. Under its aegis are a number of Commissions covering such things as Structure and Tectonics, Geochemistry, Ethics, History of Geology, Geological Education and so on. The oldest and probably the most important of these Commissions is the International Commission on Stratigraphy (ICS) which is tasked with responsibility for the subdivision of geological time going back 4.6 billion years (4.6 Ga).
To Fully Understand this Post, you will Need to Know How Geologists Divide Time
Time divisions and subdivisions are based on the stratigraphic record – the sequential accumulation of sediments and the fossil assemblages (if any) within them. Boundaries between subdivisions are based on significant, widespread and geologically rapid, transitions in the overall depositional environment. Localities where these key transitions are well exposed are referenced as type-localities and dated by isotopic methods. Each distinctive rock/fossil assemblage (divisions and subdivisions) are given a name, thus reifying them as a “thing”. Many of the names go back more than 200 years and reflect the happenstance of early geological research (see my previous post, The Invention of the Paleozoic). On a stratigraphic chart, time divisions are organised by nested hierarchies of ever smaller intervals of time. Eons (sometimes called Eonothems) are the longest: there are four of these in the 4.6 Ga geological record. Together, these four Eons are subdivided into fifteen Eras (Erathems), and these fifteen Eras together contain twenty-six Periods (Systems). The Periods contain 38 Epochs (Series), and the Epochs themselves contain over a 100 Stages (Ages).
A Stage has the shortest time interval and the smallest geographical extent of the time division.
The boundaries of Eons and Eras mark changes of global extent in tectonic processes, atmospheric composition and biospheric evolution and reflect the time evolution of these forces. However, as will become apparent, the boundaries of Periods, Epochs and Stages are much more dependent on locally available evidence, subjective judgment of experts, and the historical development of classification schemes.
If we consider the stratigraphic chart as a Library of Time, then the Eons are books, the Eras chapters, the Periods paragraphs, the Epochs sentences, and the Stages words. The last words of the last paragraph of the last chapter of the last book to be added to the library are: “to be continued…”
To carry out their task, the ICS created a number of Sub Commissions, each responsible for one of the 26 Periods in the stratigraphic record. The most recent Period, the one we live in today, is known as the Quaternary and began 2.58 million years (2.58 Ma) ago with the start of the Pleistocene Ice Age.
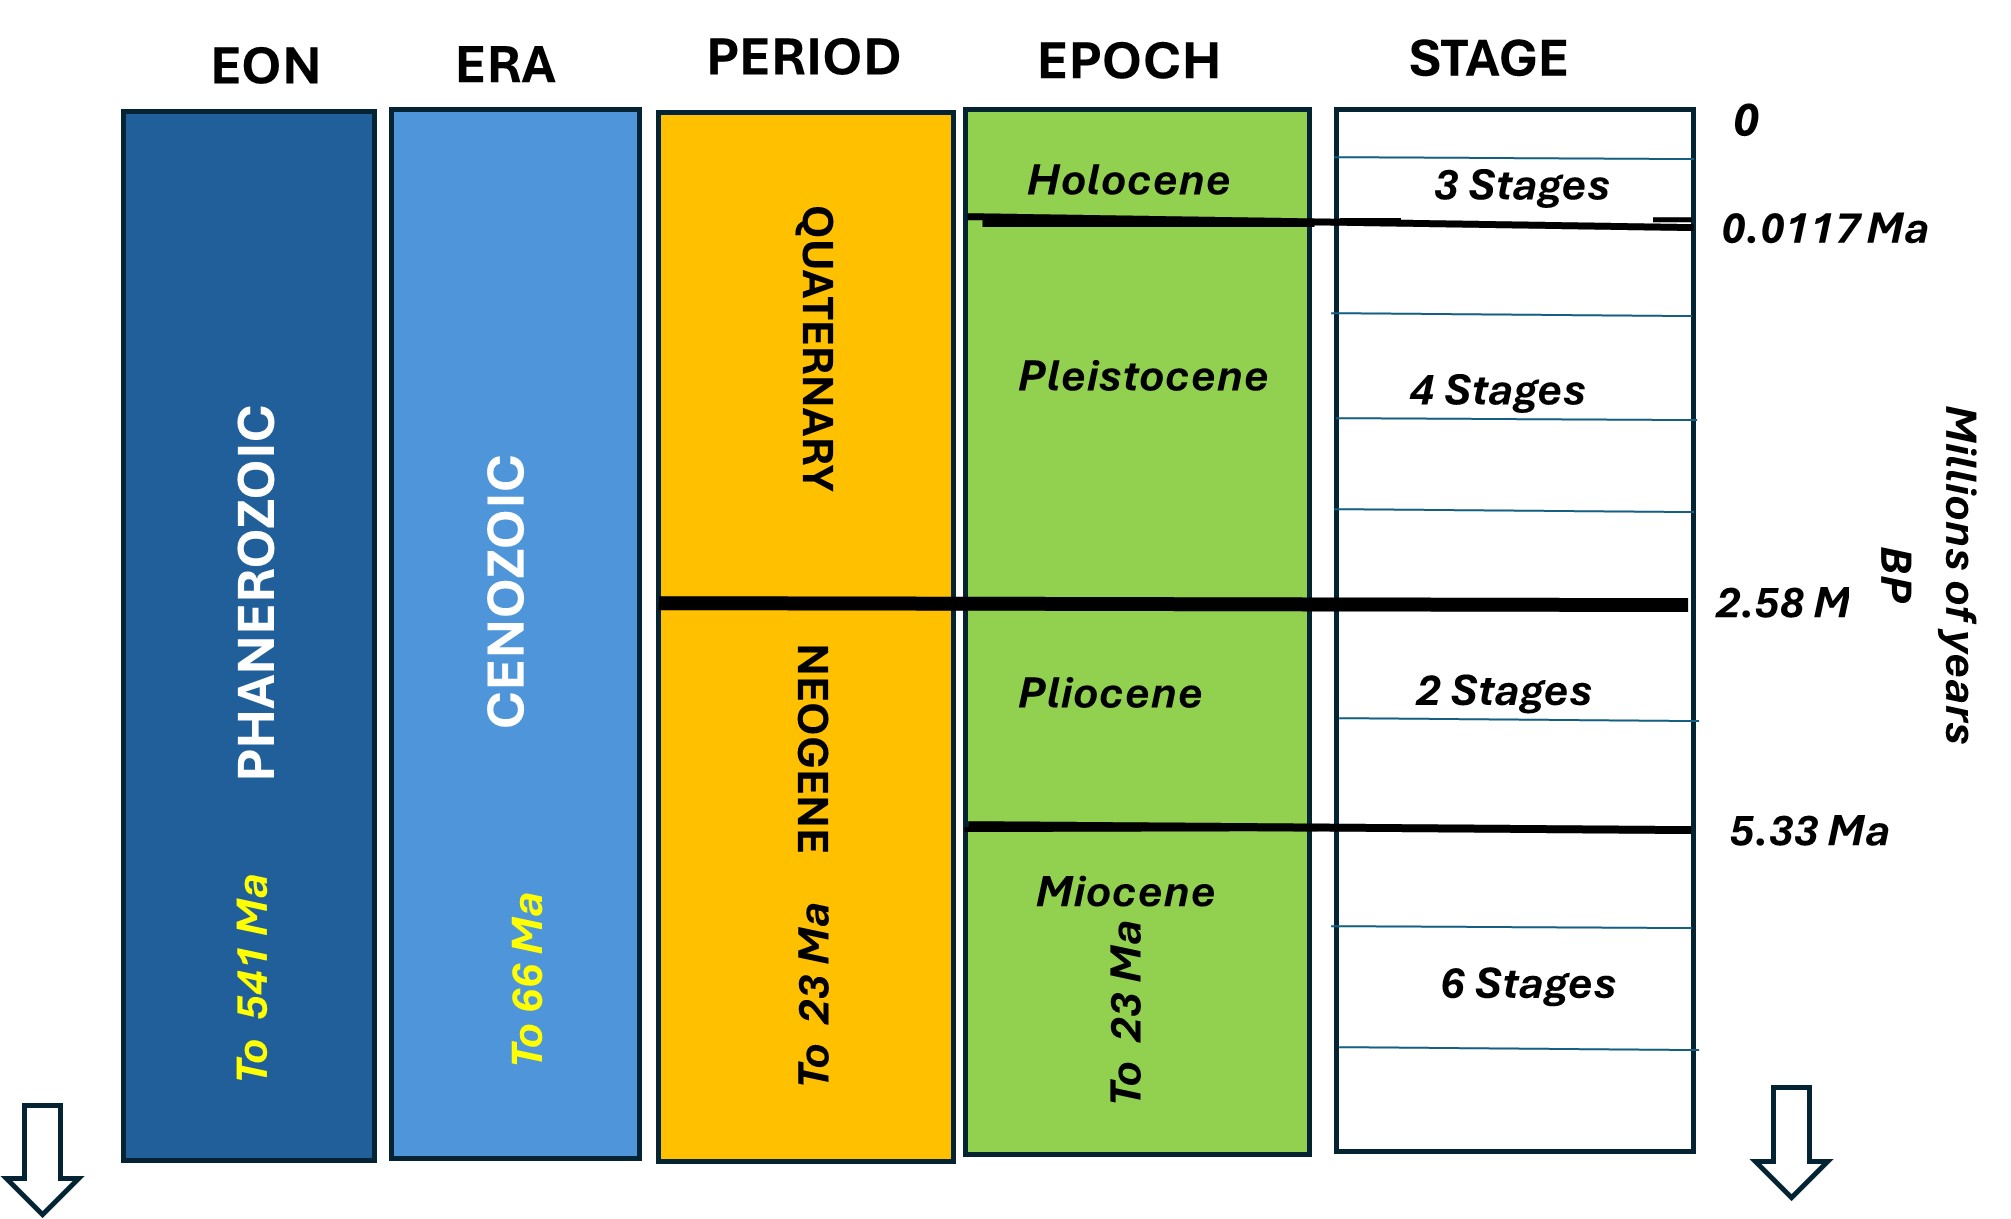
Geological subdivisions of the recent past, according to the ICS. Redrawn from their official chart.
The Cenozoic
A little over sixty-six million years ago (66 Ma), a 10 km wide rogue asteroid, travelling at 40,000 kph collided with what is now the Yucatan Peninsula of Mexico. This global catastrophe caused the near instantaneous extinction of 75% of all species of life on earth, including the non-avian dinosaurs. The event formed a centimeters-thick global sedimentary marker for the end of the Mesozoic Era and the beginning of the Cenozoic Era.

Graph A: Cenozoic temperatures over the past 65 Ma. The Quaternary Period and the Pleistocene Epoch begin at 2.6 Ma on the extreme right of the graph (labelled as Pleistocene Ice Age).
For the first 20 Ma of the Cenozoic, global temperatures were 10-15°C higher than today (and atmospheric CO2 levels 2-5 times higher), supporting a burst of adaptive evolutionary radiation of all Orders, Families and Species to fill the recently-vacated ecological niches of life. The Mammalian Order of Primates to which we belong evolved during this time.
Beginning around 45 Ma, the Hothouse temperatures which had prevailed during the early Cenozoic commenced a long slow fall. By 35 Ma, permanent ice sheets had become established over the Antarctic Continent. By 2.6 Ma, permanent ice sheets had also formed over Arctic regions. Permanent ice at both poles is the definition of an Ice Age. A new Period and a new Epoch had begun.
The Quaternary Period
The lower boundary (i.e. the beginning) of the Quaternary Period and the Pleistocene Epoch is defined by the start of the Pleistocene Ice Age when temperatures plummeted, and kilometer-thick ice became generally established over land and sea at high- to mid-latitude areas around both poles. These extreme cold conditions are known as Glacial and they affected the nature of sediments, and the fossils within them, that were deposited all over the world.
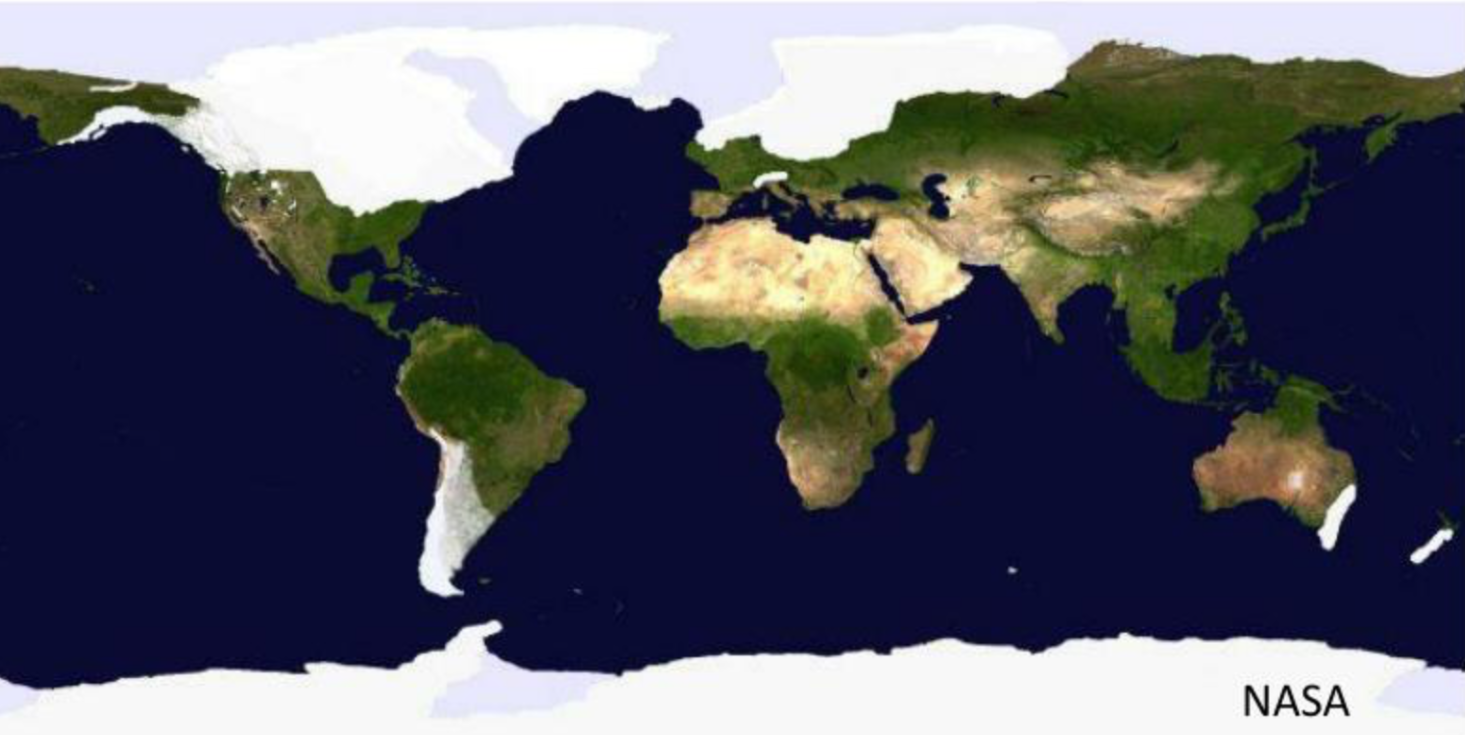 The maximum extent of Ice sheets during the last glacial episode around 20,000 years ago. Image source, NASA.
The end of the Pleistocene Epoch should therefore be when glacial conditions cease for a significant period of geological time (i.e. at least a million years). That has not happened yet. Considering the duration of previous Ice Ages, each of which lasted many tens of millions of years (such as the Sturtian Ice Age in the Proterozoic Eon around 700 Ma, the “Snowball Earth” Ice Age at the end of the Ordovician Era around 440 Ma, or the long-lived Late Paleozoic Ice Age centered around 300 Ma), the Pleistocene Ice Age – currently only 2.6 Ma old – has millions of years yet to run. (see my post, Climate Change Explained in Three Graphs). Nor are the general icy conditions of the Pleistocene ameliorating with the passage of time. The opposite is true. Glacial advances in the latter part of the Pleistocene, starting around a million years ago, have been longer, colder and more extensive than those of the earlier part of the Epoch. The change to longer cycles and colder glacial temperatures is referred to as the Mid-Pleistocene Transition.
The evidence thus indicates that the Pleistocene Ice Age is becoming ever colder with time and, as Ice Ages go, has only just begun.
The Holocene
We live in the Holocene – an interval of ice retreat, relatively warm temperatures and sea level rise. It began 11,700 (0.0117 Ma) years ago.
Pleistocene geological records show the presence of at least 45 similar temporary retreats of ice. These are called Interglacials and make up around 20% of Pleistocene time. The exact number of Interglacials depends on how their start and end dates are defined. The warm conditions of the Holocene (“warm” only with respect to the preceding glacial) are not significantly different from any of the previous interglacial episodes within the Pleistocene.
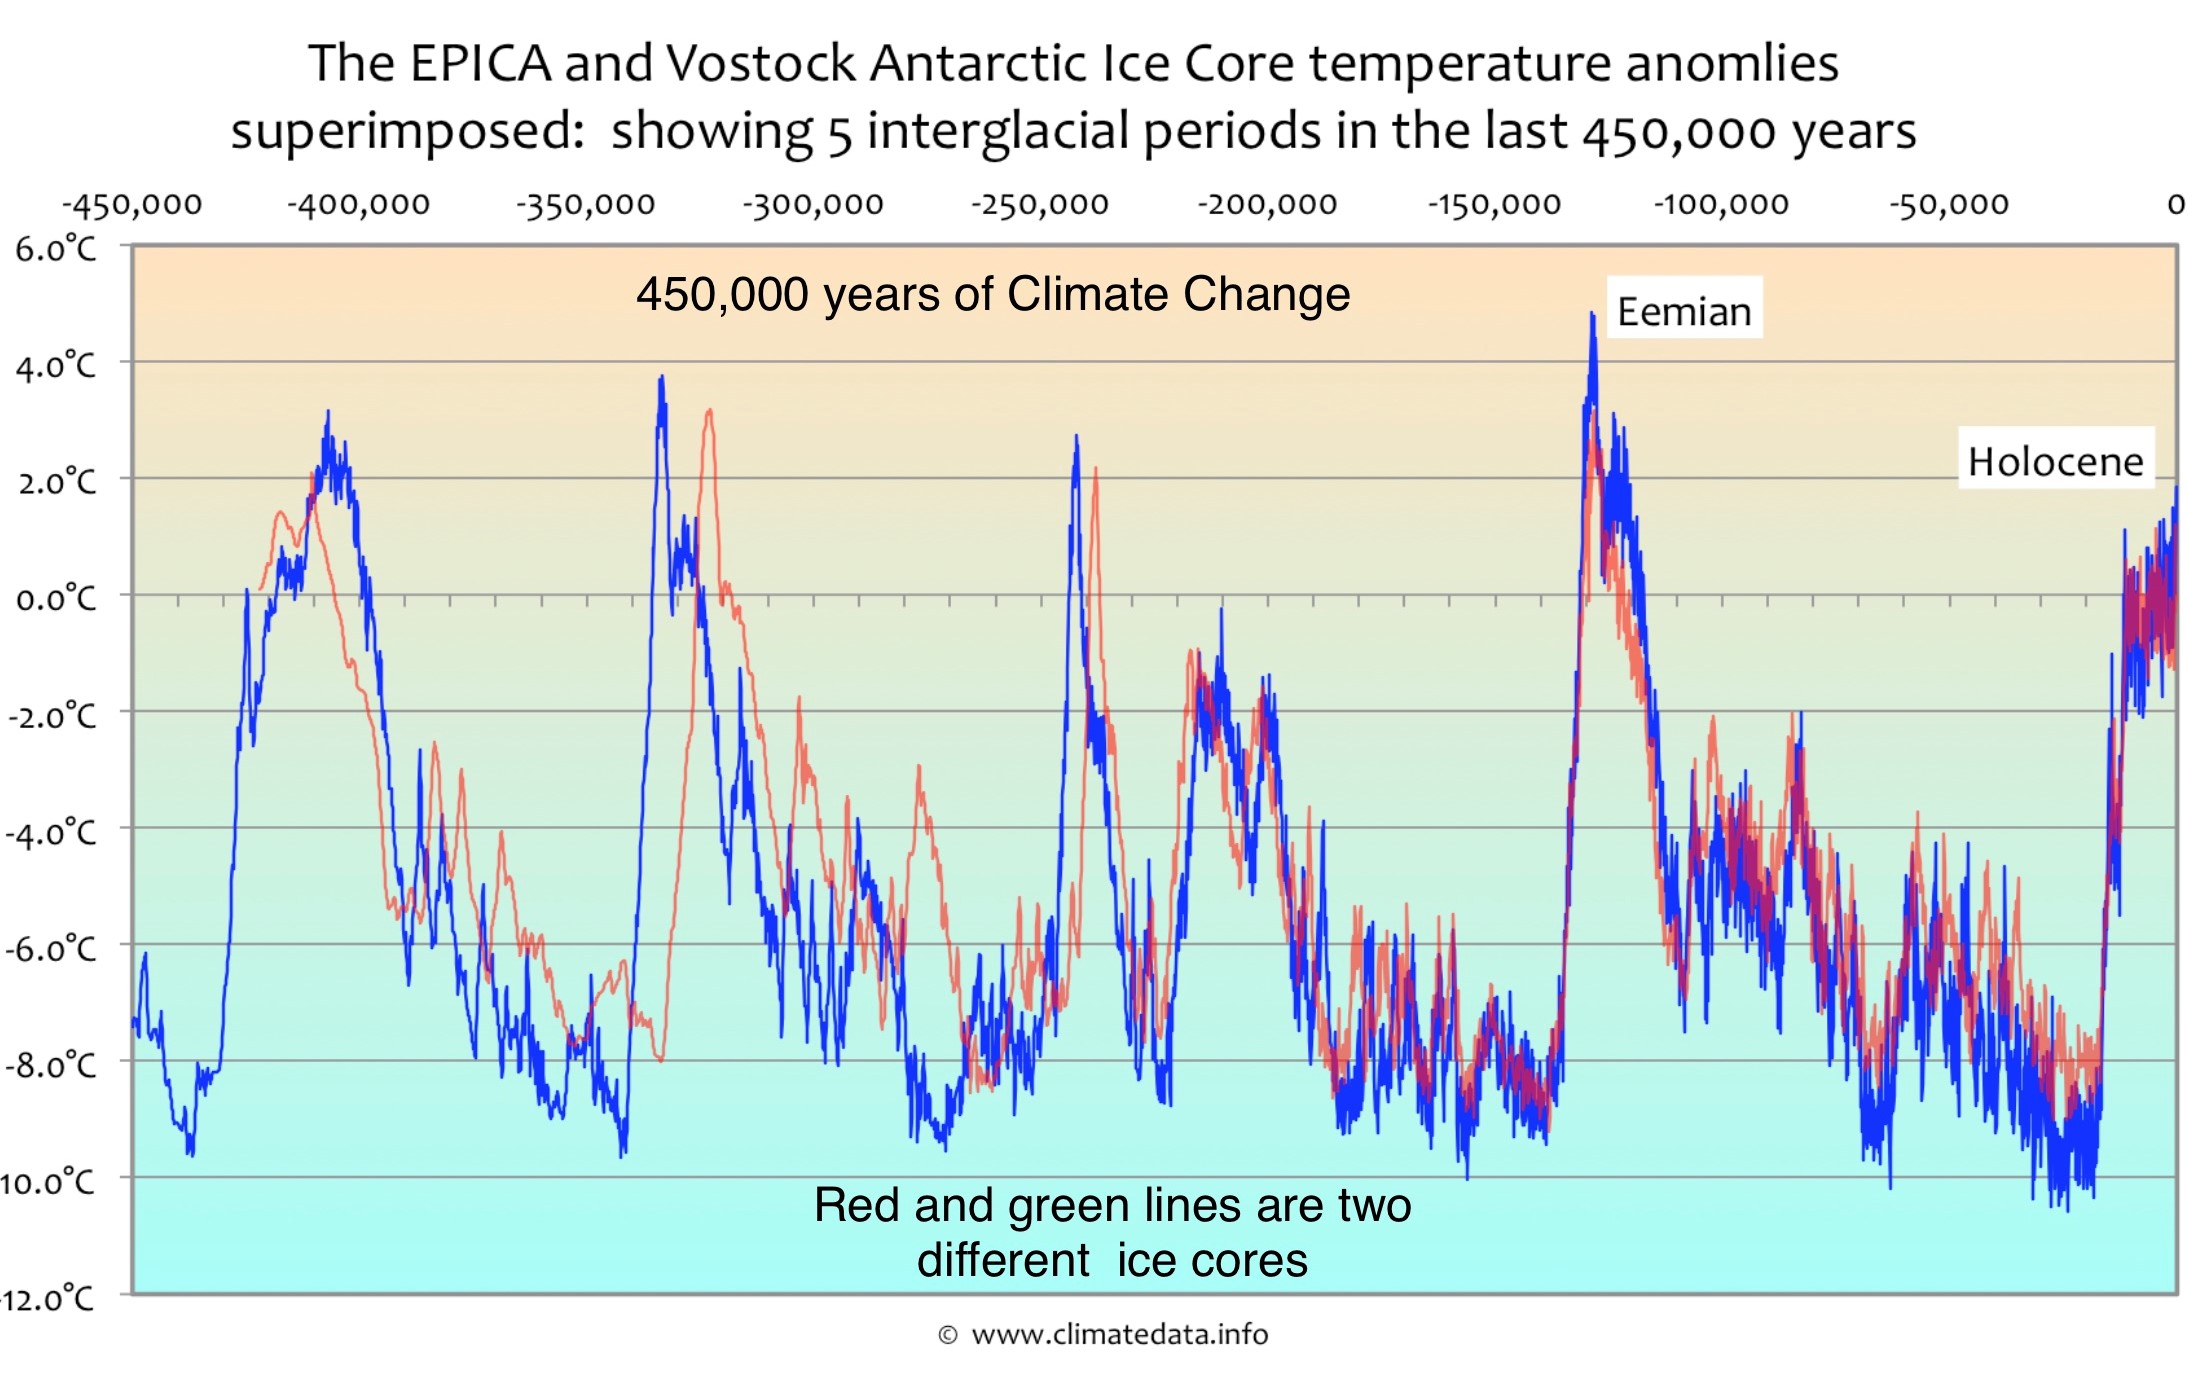
Graph B: Temperatures during the last 0.45 Ma of the Pleistocene as measured in Antarctic ice cores. Five Interglacial events are recorded, the last two labelled Eemian and Holocene. Data from www.climatedata.info
During the last interglacial (the Eemian), elephant and hippopotami gamboled on the mud flats of the River Thames. With the return of glacial conditions these species migrated south but, 120,000 years later with the arrival of the Holocene, another species of large out-of-Africa mammal gambols, once again, on the banks the Thames.
Graph B, above, shows changes in air temperature (blue) and CO2 concentration (red) over Antarctica, as measured in the VOSTOK and EPICA deep ice cores. Broadly similar graphs can be produced for other regions of the globe, but the Antarctic data provides the best resolution. The graph covers the last 20% of the Pleistocene. Five upward spikes in temperature are apparent: these are Interglacial episodes of ice retreat – the last two labeled on the graph as “Eemian” and “Holocene“. During the 10,000 year-long Eemian, West Antarctica and the Ross Sea were ice fee (Nature Geoscience 2026, https://doi.org/10.1038/s41561-026-1988-1). The Emperor Penguins survived. There were no tipping points.
There is another important takeaway from this graph: there is good correlation between temperature and CO2, but the peaks and troughs of CO2 lag the peaks and troughs of temperature by 500-1000 years. This tells us that, whereas temperature might be acting as a control on atmospheric CO2 levels, CO2 cannot be controlling temperature (since an effect cannot precede its cause).
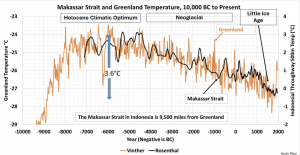
Graph C: Greenland ice core data from Vinther et al 2009: https://www.nature.com/articles/nature08355. and Macassar Strait benthic sediment data from Rosenthal et al 2013 http://science.sciencemag.org/content/342/6158/617. Compilation of the two data sets onto one graph with common scales is by Andy May.
Graph C shows air and sea temperatures over the past 10,000 years – the last 85% of the Holocene. The temperature data come from oxygen isotope ratios measured in ice cores from Greenland (orange line) and sea-floor sediment (benthic) cores from the Western Pacific (black line). The good correlation of temperature variation with time between regions on opposite sides of the globe, based 0n two completely different deposit types, is compelling.
Other graphs of Holocene temperatures using different proxy methods and from different locations around the globe have been published. You can view a comparison of these graphs, in Nature Science Data, 2020 HERE. Although differing in detail, they all show a similar pattern to graph C.
From the graph we can see a steep initial rise in Holocene temperatures to a plateau around 10,000-5000 years ago. This time interval is known as the Holocene Climate Optimum. Optimum, that is, with respect to life on earth. During the HCO, the only permanent ice to survive in the world were those of Antarctica, Greenland and the high plateaus and valleys of the great mountain ranges.
The HCO was followed by a slow and gradual decline in global temperatures and the reappearance and steady advance of mountain glaciers, reaching their maximum extent during the informally named Little Ice Age. The LIA began around 800 years ago and lasted until the middle of the 19th century. Its coldest temperatures (nadir) occurred during the 17th Century – a century of global failed harvests, plagues, invasions, revolutions, civil war, religious pogroms and, in Europe and North America, the judicial murder of thousands of harmless old women accused of witchcraft.
See “Global crisis: Climate Change and Catastrophe in the 17th Century” by Geoffrey Parker, 2013, Yale University Press: ISBN 978-0-300-15323-1;
also “The Crisis of the 17th Century” by Oxford historian Hugh Trevor Roper, 1967, Liberty Fund, ISBN 978-1-61487-084-4).
During the “Little Ice Age” the world had a modest foretaste of what a return to full glacial conditions might mean for our civilisation. That inevitable return will not be to a new Ice Age, just the return, after a brief period of relief, to the normal conditions of the Pleistocene Ice within which we are already living.
Is the Holocene Unique among Pleistocene Interglacials?
Comparing graphs B and C, all the interglacials of the Pleistocene for which we have sufficient resolution show a similar strongly skewed pattern – a steep initial rise to a plateau, followed by a long slow fall to Glacial or Neoglacial conditions. The relentless decline in global temperature following the Holocene Climate Optimum follows this pattern and provides an ominous pointer to the next episode of Pleistocene glaciation.
Beginning around 100-150 years ago (at the extreme right of the ice-core data of graph C), there is a steep upward spike in global temperature of 1-1.5° C. This is the Modern Warm Period (MWP) – the subject of much current existential angst from scientists who should know better (see my previous post HERE). But modern global temperatures are only “warm” when compared to the anomalously low temperatures of the preceding Neoglacial. Compared to temperatures that were normal for the majority of the Holocene, today’s temperatures are relatively cool. Compared to temperatures that were normal for the first 60 million years of the Cenozoic – when life on earth boomed – they are catastrophically cold.
From graph C we can also see that increases and decreases in global temperature of up to 3° C, over relatively short time periods, have occurred every 500-1000 years or so throughout Holocene time.
There is nothing unusual or remarkable about the Holocene other than that it corresponds with and helped facilitate the rise of human civilisation.
There is nothing unusual or remarkable about the Modern Warm Period other than that the academic stratigraphers of the ICS Sub-Committee for the Quaternary happen to live within it.
But the ICS Interprets Pleistocene Data Differently…
According to the ICS, and with the approval of the IUGS, the Pleistocene Epoch (or Pleistocene Ice Age) finished, terminated and collapsed forever 11,700 years ago (0.0117 Ma), to be replaced by the Holocene Epoch. These august bodies must therefore consider that the Holocene interglacial is fundamentally different from the numerous interglacials that preceded it.
To be logically consistent, if the Holocene is a separate Epoch within the Quaternary, then all previous Interglacials and Glacials of the Quaternary must be judged as Epochs also. With 90 or more Epochs, the Quaternary would then contain more than three times as many Epochs as all other 26 Periods of the stratigraphic record combined. An absurd proposition. And the Quaternary is not finished yet.
In this dilemma, the ICS appears to be trapped in an epistemological maze with no clear roadmap to follow.
Because the sediments are so recent, stratigraphers of the Quaternary have a plethora of available evidence enabling them to create ever finer subdivisions of geologic time. But that is no excuse to elevate these micro-divisions to the status of “Epochs”. Otherwise, we would have to conclude that an Epoch of the Quaternary is equivalent to a mere sedimentary horizon of the Paleozoic. If there is to be logic and meaning to standard terms for the division of geologic time, consistency of definition is surely vital.
But could the ICS be correct in concluding that the Pleistocene Ice Age ended 12,000 years ago with the beginning of the Holocene? It will be another million years before we can be 100% certain of the answer to that question. But we don’t need to wait that long. Based on the evidence presented, I am more than 90% certain that the glaciers of the Pleistocene will return. Whether that be in 500, 1000 or 2000 years’ time, we just don’t know.
The members of the ICS apparently consider that, starting from the time of the cultural Neolithic Revolution (made possible by the benign climate of the early Holocene), humans have caused sufficiently large changes to global sedimentary processes and fossil assemblages to justify raising the status of the Holocene from merely the most recent of the many Pleistocene interglacials, to a unique stratigraphic Epoch in its own right.
Whatever the reasoning of the ICS, this is a controversial and debatable proposition. As the late, great, Carl Sagan wrote in 1979: “Extraordinary claims require extraordinary evidence”. No such evidence has been presented.
But it Gets Worse…
Astonishingly, in 2019, the ICS made another proposal to their governing body, the IUGS. They advocated the creation of a brand-new Epoch to succeed the Holocene Epoch. This Epoch was to be called the “Anthropocene”, a neologism cobbled together from two Greek words meaning roughly: “The New Age of Man”. It was proposed that the Anthropocene started around 1950AD.
This is equivalent to the fond hopes of 1946 that the establishment of the United Nations would lead to a new epoch of Global Peace and Stability (Pax Americana?) that would last for 1,000 years.
To their credit, in 2019, the IUGS, in a near-unanimous vote, rejected the Anthropocene proposal of the ICS.
I strongly suspect that the stratigraphic proposals of the ICS concerning the Holocene and Anthropocene were influenced by the current fashionable scientific meme that the effects of modern human activities, including CO2 emissions, are strong enough to overwhelm all other terrestrial and extraterrestrial forces that have controlled temperature, sediment deposition and life around the globe for billions of years.
Back to the Future…
Our remote descendants, as they shiver in their caves, may well think otherwise.