Here’s the thing
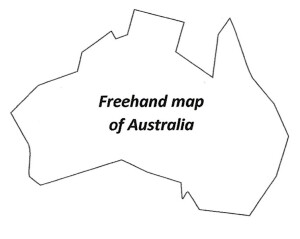
You know what Australia looks like. You would recognise it on a map: its general shape, the peninsulas, the great gulfs. You could draw it from memory, probably, and if you did, it might look something like this:
That’s a pretty good effort and would certainly serve to identify the island continent, but it does not look a bit like a real map. No one, for example, would ever think that you had painstakingly traced this outline from an atlas. What you have drawn is a cartoon. Actual coastlines are seldom, if ever, composed of straight lines. Actual continental shapes are not irregular polygons. With some notable exceptions (crystals for example, some biological structures) few things in nature are defined by the straight lines, planes and regular shapes of classical Euclidean geometry.
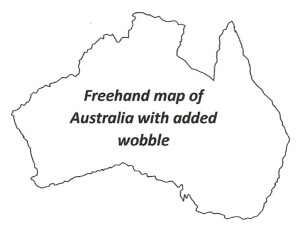
Now try drawing the same map again, but this time employing an irregular wriggly line to outline the coast and to create a multitude of completely imaginary small-scale bays and headlands. Here it is:
This looks much more realistic. Why is that? Because that’s what coastlines look like (especially rocky ones).
Geographers Wobble
What you have done in figure 2 is often referred to as “geographers’ wobble”, and not usually as a compliment. However, Geographers’ wobble is not artistic license, it is not decoration to make a map look pretty or interesting in the style of old-time cartographers (here be dragons). In the absence of a finely-detailed data base, the geographer has chosen the correct type of irregular line to use in outlining a coast – and that is not a straight line. It is a fractal line. The geographer chose to use a line with the correct fractal dimension for his purpose.
More on fractals and fractal dimensions later.
Geologists Wobble too
When making a detailed outcrop map, geologists often use the same technique – one could call it “geologists’ wobble” (1)
Figure 3
Consider the map below, originally compiled at 1:1000 scale (the survey pegs are 40m apart). It is a portion (one of 12 field sheets) of a geological map that aims to show all outcrop of more than 1-2 m across within a mineralised prospect area.
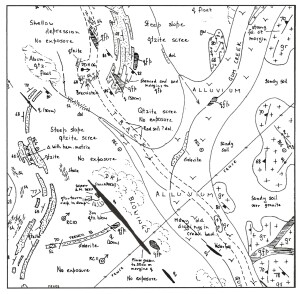 Figure 4 An outcrop geology map a 1:1000 scale
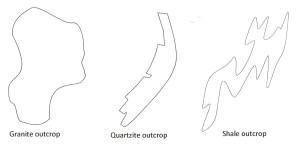
It would be impractical to do an exact point by point survey of each of the outcrops in the area. Rather the geologist compiling the map surveyed a few points on each outcrop by triangulating on survey markers, then took compass bearings and counted paces as he walked around it, sketching in the details. Note that the style of line used to outline each outcrop is dependent upon the rock type. In this area, shale units (sh) are exposed as short, interconnected runs poking through the surface rubble: the map outline of shale outcrop thus has a very complex shape with many large-scale and small-scale re-entrants. The quartzite (qtzite) unit occurs in long, parallel-sided, strike ridges broken by weathering along an orthogonal jointing: by comparison with the shale, its map outline is simpler and more geometric in shape. The simplest outcrop shapes of all are those of the granite (gr) which has rounded outlines resulting from its massive nature and the effects of spheroidal (onion skin) weathering.
Examples – extracted from the map – of these different line styles are shown below. The outline of each unit has a different fractal dimension which the geologist attempted to capture with an appropriate type of line.
Figure 5 Fractal shapes of rock outcrops in figure 4
Fractals and Fractal Dimensions
The idea of a fractal dimension was developed by French-American mathematician Benoit B Mandelbrot in the 1960s and 70s as a way of quantifying the degree of complexity of folded lines and sheets. The idea became widely disseminated beyond his specialist field with the publication of his beautifully illustrated best-selling book The fractal geometry of Nature (1983: W H Freeman, San Francisco, 468pp).
In classical Euclidean geometry, a line is a one-dimensional entity (1-D) with a length but neither width nor thickness. It retains its 1-D identity no matter how complexly it is folded. Mandelbrot reasoned that if a line were sufficiently folded within the plane of a 2-D surface then it would begin to fill that surface and so approach the dimensions of the sheet within which it is embedded. In other words, depending on the degree of complexity of the folding, it will have a dimension somewhere between 1 and 2. He called this the fractal dimension and the line itself a fractal object.
Similarly, a 1-D or a 2-D object (think of a length of thread or sheet of paper, ignoring their thickness), folded within 3-D space, will have a fractal dimension somewhere between 2 and 3[2].
Fractal lines and shapes are the characteristic of natural objects. Trees, topography, turbulence, coastlines and cauliflowers, snowflakes and stock markets, protein molecules, distribution of galaxies, folded sediments, the outlines of rock outcrop.
Mandelbrot realised that fractal shapes can be quantified by comparing the detail of the object that is apparent when viewed at different scales.
Take the outline of a coast – a typical fractal line. How long is this line? Obviously, it will be much longer if we measure it with a 1-meter-long ruler than if we measure it with a 100-meter-long ruler. How much longer? That will depend upon how wriggly and convoluted the coastline at whatever level of detail we view it, and that depends on its fractal dimension. If coastlines had regular Euclidean shapes – segments of polygons, circles or ellipses, for example – we could step off its length with dividers of shorter and shorter openings and our succession of results would progressively converge on a finite answer. But for a fractal line there is no convergence: the coastline has an infinite length! The reason for this paradoxical result is that the fractal dimension you can measure will be approximately the same no matter how far you zoom down into the detail of the line.
Mandelbrot defined Fractal Dimension (FD) as the statistical ratio of the change in detail with the change in scale. It matters little whether the FD ratio of a rocky coast is measured on a 1,000,000 scale map, on the bays and headlands of a 100,000 scale map or on a map of a rock pool on the shore at 1:1 scale. At levels of detail that range through several orders of magnitude, the Fractal Dimension of a rocky coast will be approximately the same. That is not to say that, if you overlaid a tracing of 100 km of coastline over a tracing of 1 km of coastline, there would be a neat match, but the lines would look the same: they would have the same style. Without further information, it would be impossible, from the lines alone, to say at what level of detail it was being viewed. That is what is meant by saying that the Fractal Dimension is scale invariant. Fractal shapes have scale-invariant self-similarity.
The map of the rock pool is a fractal for the map of the bay in which it occurs, and the map of the bay is itself a fractal for the map of the whole rocky coastline. Similarly, small folds on the limbs of large folds can be fractals for the large fold, which may of course be a fractal for an even larger fold. This useful relationship has been known to geologists for almost 130 years, the first example of the practical use of what we now know as fractal geometry. When I was a geology student in the 1960s we were taught to call this “Pumpelly’s Rule” after USGS geologist Raphael Pumpelly (he of the eponymous mineral) who first described these relationships in 1894(4).
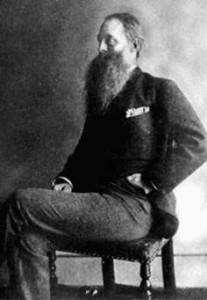 Figure 6: Raphael Pumpelly, 1837-1923. Geology & Mining Professor Harvard University (1866-75). Founding Member of the United States Geological Survey (1879), Director of the USGS (1884). President of the Geological Society of America (1905)
In Nature, fractal shapes are only ever self-similar through a limited range of scales. There are practical limits. Patterns are never repeated endlessly to infinity. One cannot strictly say (parodying Jonathon Swift) that:
So, Geologists observe, a fold,
Hath smaller folds that on limbs prey,
And these have smaller yet to parasite ‘em,
And so proceed ad infinitum.
However, fractal shapes and patterns created by computer through the iteration of simple non-linear algorithms can have perfect self-similarity through an infinity of scales. The best-known example of a computer- generated set of fractals is the famous Mandelbrot Set.
The idea of the scale invariance of fractal shapes has great relevance in structural geology, where the structure of large regions (which cannot be directly observed) has to be deduced from observation of small outcrops in the field. This topic is explored in an earlier post (LINK).
The box counting method for calculating Fractal Dimension
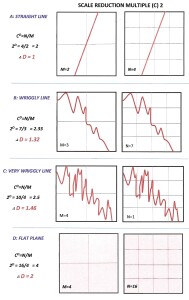
I understand that some GIS software packages, such as ArcGIS, provide sub-programs for calculating fractal dimensions. However, it can be done manually. Mandelbrot’s insight that the Fractal dimension is the statistical ratio of change in detail with the change in scale enabled him to provide the following formula for calculating the FD of a folded line embedded in 2-D space:
CD = N/M
Where the scale is a unit grid in 2-D space, and:
C is the scale reduction multiple D is the fractal dimension
N is the number of squares occupied by the fractal in the high-resolution 2-D grid.
M is the number of squares occupied by the fractal in the low-resolution 2-D grid
Figure 7 below illustrates the application of the formula to calculate the fractal dimension of a line. To demonstrate the technique and for simplicity of illustration, in the examples below I have chosen a low reduction multiple (C) of 2. However, it should be noted that the larger the value of C, the more accurate and precise will be the calculated value of the Fractal Dimension (D).
Figure 7 Calculating the fractal dimension of a line (click for a larger, sharper image)
Some numbers
A typical rocky coastline has a fractal dimension (FD) of 1.2 – 1.3. Low-lying coasts of sediment accumulation (the 80-mile beach, for example) have lower fractal dimensions. An FD of around 1.2 was instinctively used in drawing the map of Australia shown in figure 2. That is an exaggeration as the actual coastline, averaged over the whole continent, has been recently measured at 1.114 (LINK)
The FD of the west coast of Britain has been calculated as 1.25 (LINK) (3)
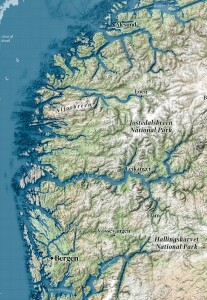
The FD of the coast of Norway - a particularly rugged and fiord-indented coastline - has been calculated (by Slartybartfast, among others (LINK from p 139)) at 1.52.
The outline of the granite outcrop in figure 5 has an approximate FD of 1.1
The outline of the quartzite outcrop in figure 5 has an approximate FD of 1.2
The outline of the shale outcrop in figure 5 has an approximate FD of 1.3
Figure 8 The coastline of southwest Norway. Fractal Dimension 1.52
Conclusion
The terms Geographers’ Wobble and Geologists’ Wobble may sound unscientific and uncomplimentary, but they describe procedures based on an instinctive understanding that natural objects are fractal and cannot be described graphically using the lines and shapes of classical Euclidean geometry. Fractal lines provide a more accurate representation of reality.
Following Mandelbrot, that reality has come to be known as Chaos – the expression of non-linear natural processes. The descriptors of Chaos are fractals, fractal dimensions and scale-invariant self-similarity.
(1) See footnote 22, p46 in Marjoribanks R W: Geological methods in mineral exploration and mining. Springer 238pp.
[2] The fractal object also assumes the physical properties of the higher dimension. As every schoolboy knows, a pellet of scrunched up paper (FD of, say, 2.8), flicked with a ruler onto the neck of a classmate in front, will always produce a satisfying reaction.
(3) Mandelbrot, BB 1967: How long is the coast of Britain? Statistical self-similarity and fractal dimension. Science 156, Issue 3775, pp 636-638 DOI.10.1126/Science.156.3775.636
(4) Pumpelly R, Wolff JE & Dale TN: 1894. The Geology of the Green Mountains. USGS Memoir 23, 157p.
All comments are welcome
